
A First Course in Probability (10th Edition)
10th Edition
ISBN: 9780134753119
Author: Sheldon Ross
Publisher: PEARSON
expand_more
expand_more
format_list_bulleted
Related questions
Concept explainers
Question
This chart displays the home region of approximately 500 students that will enter College Q as the class of 2014. Choose the answer that best describes a comparison between the number of students from the Midwest and the number of International students.
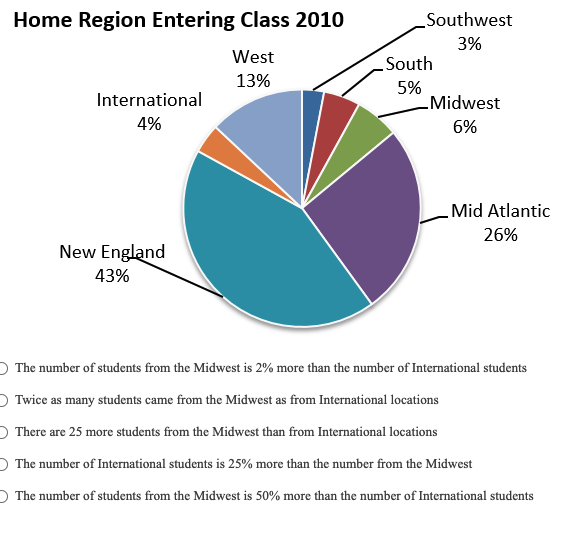

Transcribed Image Text:Home Region Entering Class 2010
Southwest
3%
West
South
13%
5%
LMidwest
International
4%
6%
Mid Atlantic
26%
New England
43%
O The number of students from the Midwest is 2% more than the number of International students
O Twice as many students came from the Midwest as from International locations
O There are 25 more students from the Midwest than from International locations
O The number of International students is 25% more than the number from the Midwest
O The number of students from the Midwest is 50% more than the number of International students
Expert Solution
This question has been solved!
Explore an expertly crafted, step-by-step solution for a thorough understanding of key concepts.

This is a popular solution

Trending nowThis is a popular solution!

Step by stepSolved in 2 steps

Knowledge Booster


Learn more about
Need a deep-dive on the concept behind this application? Look no further. Learn more about this topic, probability and related others by exploring similar questions and additional content below.Similar questions
- Eight movies based on Marvel comic book characters for the U.S. box office as of fall 2017 are shown in the accompanying table, with domestic gross rounded to the nearest million. Find and interpret the median domestic gross of the top five of these eight Marvel movies.arrow_forwardPaleontology students went on a dig for fossils. The following data set contains the number of fossils found by a sample of 12 students. 9,12,8,49,15,12,21,17,19,13,18,119,12,8,49,15,12,21,17,19,13,18,11 Click to download the data in your preferred format. CrunchIt! CSV Excel JMP Mac Text Minitab PC Text R SPSS TI Calc What is the median number of fossils found by the students? median: fossilsarrow_forwardFewer than 91% of adults have a cell phone. In a reputable poll of 1214 adults, 86% said that they have a cell phone. Find the value of the test statistics.arrow_forward
- Wageweb conducts surveys of salary data and presents summaries on its Web site. Based on salary data as of October 1, 2002, Wageweb reported that the average annual salary for sales vice presidents was $142,111, with an average annual bonus of $15,432 (Wageweb.com, March 13, 2003). Assume the following data are a sample of the annual salary and bonus for 10 sales vice presidents. Data are in thousands of dollars. Vice President 1 2 3 4 5 6 7 8 9 10 Salary 135 115 146 167 165 176 98 136 163 119 Bonus 12 14 16 19 22 24 7 17 18 11 Develop a scatter diagram for these data with salary as the independent variable. What does the scatter diagram developed in part (a) indicate about the relationship between salary and bonus? Use the least squares method to develop the estimated regression equation. Provide an interpretation for the slope of the estimated regression equation. Predict the bonus for a vice president with an annual salary of $120,000.arrow_forwardConstruct a vertical and horizontal bar graph for the number of employees (in thousands) of a sample of the largest tech companies as of 2014arrow_forward256 math majors were asked whether they had completed theirscience requirement, and 97 said "yes". Find the best point estimate for the proportion of math majors who have completed their science requirement. Round to four decimal places.arrow_forward
- Describe about the Ranked Data and Ordinal Measurement.arrow_forwardThe Condé Nast Traveler Gold List for 2012 provided ratings for the top 20 small cruise ships.† The data shown below are the scores each ship received based upon the results from Condé Nast Traveler's Annual Readers' Choice Survey. Each score represents the percentage of respondents who rated a ship as excellent or very good on several criteria, including Itineraries/Schedule, Shore Excursions, and Food/Dining. An overall score was also reported and used to rank the ships. The highest ranked ship, the Seabourn Odyssey, has an overall score of 94.4, the highest component of which is 97.8 for Food/Dining. Ship Overall Itineraries/Schedule ShoreExcursions Food/Dining Seabourn Odyssey 94.4 94.6 90.9 97.8 Seabourn Pride 93.0 96.7 84.2 96.7 National Geographic Endeavor 92.9 100.0 100.0 88.5 Seabourn Sojourn 91.3 88.6 94.8 97.1 Paul Gauguin 90.5 95.1 87.9 91.2 Seabourn Legend 90.3 92.5 82.1 98.8 Seabourn Spirit 90.2 96.0 86.3 92.0 Silver Explorer 89.9 92.6 92.6 88.9…arrow_forwardIn which year did Tesco have the least number of stores?arrow_forward
- The dotplot shows the distribution of passing rates for the bar exam at 185 law schools in the United States in a certain year. The five number summary is 28, 78, 86, 91.5, 99. Draw the boxplot and explain how you determined where the whiskers go. Click the icon to view a dotplot of bar exam passing rates. Draw the boxplot. Select the correct answer below. ○ A. 100 Bar-Pass Rate (%) ○ B. Q ✓ 0 100 Bar-Pass Rate (%) ○ C. ○ D. Q Q --- 0 Bar-Pass Rate (%) 100 G 0 100 Bar-Pass Rate (%) Explain how you determined where the whiskers go. Select the correct answer below and fill in the answer boxes to complete your choice. (Type integers or decimals. Do not round.) OA. The whiskers extend to the most extreme values that are not potential outliers. The left whisker extends to the smallest observation that is greater than or equal to extends to the largest observation that is less than or equal to OB. The whiskers extend to the minimum, OC. The whiskers extend to the left outlier, and the…arrow_forward A national forest service wanted to estimate the number of deer in a particular national park. They cotton tag 71 deer and release him back into the park. Later they selected a sample of 272 deer. Of the 272 dear, 17 were tagged, assuming that the portion of tag deer and the sample holds for all deer in the forest, what is the best estimate of the number of deer in the park? arrow_forwardIn a poll of 420 universities students, 197 said they were opposed to legalizing marijuana.  estimate the percentage of students who oppose legalizing marijuanaarrow_forward
arrow_back_ios
SEE MORE QUESTIONS
arrow_forward_ios
Recommended textbooks for you
- A First Course in Probability (10th Edition)ProbabilityISBN:9780134753119Author:Sheldon RossPublisher:PEARSON

A First Course in Probability (10th Edition)
Probability
ISBN:9780134753119
Author:Sheldon Ross
Publisher:PEARSON