MATLAB: An Introduction with Applications
6th Edition
ISBN: 9781119256830
Author: Amos Gilat
Publisher: John Wiley & Sons Inc
expand_more
expand_more
format_list_bulleted
Concept explainers
Question

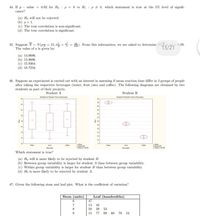
Transcribed Image Text:44. If p - value = 0.02 for Ho : p = 0 vs Hị : p # 0, which statement is true at the 5% level of signifi-
cance?
(a) Ho will not be rejected.
(b) p> 1.
(c) The true correlation is non-significant.
(d) The true correlation is significant.
45. Suppose X- N(1x = 15, 0 = = -
The value of a is given by:
From this information, we are asked to determine P A- 0.99.
13/21
(a) 14.0696.
(b) 13.9696.
(c) 15.9304.
(d) 18.7216.
46. Suppose an experiment is carried out with an interest in assessing if mean reaction time differ in 3 groups of people
after taking the respective beverages (water, fruit juice and coffee). The following diagrams are obtained by two
students as part of their projects.
Student A
Student B
Borplets ker Readien Time te Bererss
Betet ke Raen Tt Ber
24
28
22
26
24
20
22
18
16
16
14
14
12
12
10
Mean
Water
Coffee
Juce
Cafee
Beverage
Berg
Meane E
Which statement is true?
(a) Ho will is more likely to be rejected by student B.
(b) Between group variability is larger for student A than between group variability.
(c) Within group variability is larger for student B than between group variability.
(d) Ho is more likely to be rejected by student A.
47. Given the following stem and leaf plot. What is the coefficient of variation?
Stem (units)
Leaf (hundredths)
6.
47
7
13
42
8
50
29
53
9.
15
77
09 60 70 54

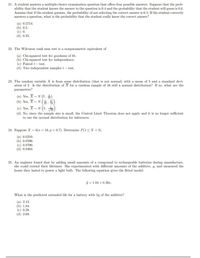
Transcribed Image Text:21. A student answers a multiple-choice examination question that offers four possible answers. Suppose that the prob-
ability that the student knows the answer to the question is 0.4 and the probability that the student will guess is 0.6.
Assume that if the student guesses, the probability of not selecting the correct answer is 0.5. If the student correctly
answers a question, what is the probability that the student really knew the correct answer?
(a) 0.5714.
(b) 0.5.
(c) 0.
(d) 0.25.
22. The Wilcoxon rank sum test is a nonparametric equivalent of
(a) Chi-squared test for goodness of fit.
(b) Chi-squared test for independence.
(c) Paired t- test.
(d) Two independent samples t- test.
23. The random variable X is from some distribution (that is not normal) with a mean of 5 and a standard devi-
ation of 2. Is the distribution of X for a random sample of 16 still a normal distribution? If so, what are the
parameters?
(a) Yes, XN (5, ).
(b) Yes, X N ( #)
(e) Yes, X~ N (5, ).
(d) No, since the sample size is small, the Central Limit Theorem does not apply and it is no longer sufficient
to use the normal distribution for inferences.
24. Suppose X- b(n = 18, p = 0.7). Determine P(1< X < 9).
(a) 0.0210.
(b) 0.0596.
(c) 0.9790.
(d) 0.9404.
25. An engineer found that by adding small amounts of a compound to rechargeable batteries during manufacture,
she could extend their lifetimes. She experimented with different amounts of the additive, g, and measured the
hours they lasted to power a light bulb. The following equation gives the fitted model:
j = 1.84 + 0.28z.
What is the predicted extended life for a battery with 3g of the additive?
(a) 2.12.
(b) 1.84.
(c) 0.28.
(d) 2.68.
Expert Solution
This question has been solved!
Explore an expertly crafted, step-by-step solution for a thorough understanding of key concepts.
Step by stepSolved in 2 steps with 2 images

Knowledge Booster
Learn more about
Need a deep-dive on the concept behind this application? Look no further. Learn more about this topic, statistics and related others by exploring similar questions and additional content below.Similar questions
- A correlation of r = – 0.95 is stronger than r = + 0.70. true or false?arrow_forwardMy solution is incorrectarrow_forwardAn ecologist is interested in exploring the relationship between pollination rate and the number of bees present at apple orchards. The relationship is: (Pollination rate) = 372.6 + 13.5 x (bees) with r = 0.80. The best interpretation of the correlation coefficient is: (pick one) 1. 64% of the variability in pollination rate observed at apple orchards is explained by the relationship with the number of bees 2. the correlation between pollination rate and number of bees is 0.64 3. 80% of the variability in number of bees at apple orchards is explained by the relationship with the pollination rate 4. the correlation between pollination rate and number of bees is 0.80arrow_forward
- Are there ever any circumstances when a correlation such as Pearson’s r can be interpreted as evidence for a casual connection between two variables? If yes, what circumstances?arrow_forwardA researcher computes the correlation coefficient r= 0.4212 for an explanatory and response variable. What proportion of the changes in the response variables value is accounted for by the change in the explanatory variable's value? Give your answer to four decimal places.arrow_forwardTrue or False: A correlation that is calculated to correct for unreliability or restriction of range can be above 1.0 or lower than -1.0.arrow_forward
arrow_back_ios
arrow_forward_ios
Recommended textbooks for you
 MATLAB: An Introduction with ApplicationsStatisticsISBN:9781119256830Author:Amos GilatPublisher:John Wiley & Sons Inc
 Probability and Statistics for Engineering and th...StatisticsISBN:9781305251809Author:Jay L. DevorePublisher:Cengage Learning
 Statistics for The Behavioral Sciences (MindTap C...StatisticsISBN:9781305504912Author:Frederick J Gravetter, Larry B. WallnauPublisher:Cengage Learning
 Elementary Statistics: Picturing the World (7th E...StatisticsISBN:9780134683416Author:Ron Larson, Betsy FarberPublisher:PEARSON
 The Basic Practice of StatisticsStatisticsISBN:9781319042578Author:David S. Moore, William I. Notz, Michael A. FlignerPublisher:W. H. Freeman
 Introduction to the Practice of StatisticsStatisticsISBN:9781319013387Author:David S. Moore, George P. McCabe, Bruce A. CraigPublisher:W. H. Freeman

MATLAB: An Introduction with Applications
Statistics
ISBN:9781119256830
Author:Amos Gilat
Publisher:John Wiley & Sons Inc

Probability and Statistics for Engineering and th...
Statistics
ISBN:9781305251809
Author:Jay L. Devore
Publisher:Cengage Learning

Statistics for The Behavioral Sciences (MindTap C...
Statistics
ISBN:9781305504912
Author:Frederick J Gravetter, Larry B. Wallnau
Publisher:Cengage Learning

Elementary Statistics: Picturing the World (7th E...
Statistics
ISBN:9780134683416
Author:Ron Larson, Betsy Farber
Publisher:PEARSON

The Basic Practice of Statistics
Statistics
ISBN:9781319042578
Author:David S. Moore, William I. Notz, Michael A. Fligner
Publisher:W. H. Freeman

Introduction to the Practice of Statistics
Statistics
ISBN:9781319013387
Author:David S. Moore, George P. McCabe, Bruce A. Craig
Publisher:W. H. Freeman