
Advanced Engineering Mathematics
10th Edition
ISBN: 9780470458365
Author: Erwin Kreyszig
Publisher: Wiley, John & Sons, Incorporated
expand_more
expand_more
format_list_bulleted
Related questions
Question
A sales Director who lives in a city a is required to fly to a regional‘s office and cities BCD in E. The weather graph shows the one-way airfares between any two cities. Use the brunt force method to find the optimal solution.

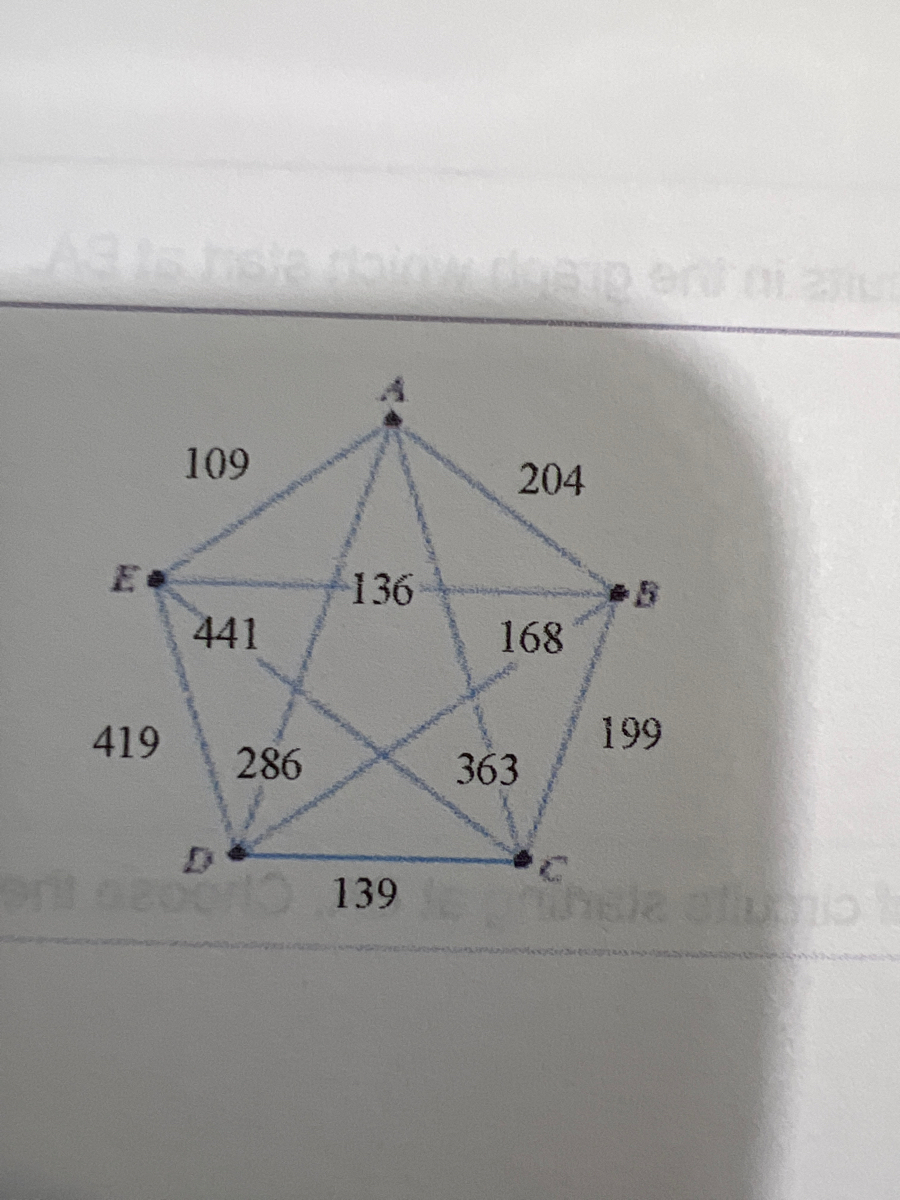

Transcribed Image Text:**Graph Representation and Explanation:**
The image provides a weighted undirected graph in the shape of a pentagon with an internal star. The vertices of the graph are labeled A, B, C, D, and E. The edges connecting these vertices are labeled with weights.
- **Vertices and Edges:**
- Vertex A is connected to:
- B with a weight of 204
- C with a weight of 363
- D with a weight of 136
- E with a weight of 109
- Vertex B is connected to:
- C with a weight of 168
- D with a weight of 199
- E with a weight of 441
- Vertex C is connected to:
- D with a weight of 139
- E with a weight of 286
- Vertex D is connected to:
- E with a weight of 419
The edges form a pentagon with a star inside, indicating that every vertex is directly connected to every other vertex. Consequently, this is a representation of a complete graph, specifically \( K_5 \).
- **Edge Weights:**
- A - B: 204
- A - C: 363
- A - D: 136
- A - E: 109
- B - C: 168
- B - D: 199
- B - E: 441
- C - D: 139
- C - E: 286
- D - E: 419
This type of graph can be used to model various scenarios where multiple points need to be interconnected, each with a certain cost or distance, such as network design, travel planning, and more. The structure highlights the complexity and various paths one can take to traverse between any two points.
Expert Solution
This question has been solved!
Explore an expertly crafted, step-by-step solution for a thorough understanding of key concepts.

Step by stepSolved in 2 steps

Knowledge Booster

Similar questions
- Derive the linear interpolant through the two data points (1.0, 2.0) and (1.1, 2.5).Then, derive the quadratic interpolant through these two points and the point (1.2, 1.5). Show a graphdepicting this situation.arrow_forwarda. According to the linear model, what was the average cost of room and board at public four-year colleges for the school year ending in 2013? The average cost was $___(Round to the nearest dollar as needed.) Im looking at the graph image and still do not understand this math problem. Please help. Both answers that I came up with for this solution, 5877 were incorrect and 7228 was also incorrect.arrow_forwardThe number (in millions) of employees working in educational services in a particular country was 16.6 in 2005 and 18.5 in 2014. Let x = 5 correspond to the year 2005, and estimate the number of employees in 2010. Assume that the data can be modeled by a straight line and that the trend continues indefinitely. Use two data points to find such a line and then estimate the requested quantity. Let y represent the number of employees. The linear equation that best models the number of employees (in millions) is (Simplify your answer. Use integers or decimals for any numbers in the equation. Round to the nearest hundredth as needed.) In 2010, the number (in millions) of employees working in education services would be (Type an integer or a decimal rounded to the nearest hundredth as needed.)arrow_forward
- When coastal power stations take in large quantities of cooling water, it is inevitable that a number of fish are drawn in with the water. Various methods have been designed to screen out the fish. A particular article examined intake fish catch at an English power plant and several other variables thought to affect fish intake. y = fish intake (number of fish)x1 = water temperature (°C)x2 = number of pumps runningx3 = sea state (values 0, 1, 2, or 3)x4 = speed (knots) Part of the data given in the article were used to obtain the estimated regression equation(based on n = 26). SSRegr = 1486.6 and SSResid = 2230.1 were also calculated. (a) What proportion of observed variation in fish intake can be explained by the model relationship? (Round your answer to four decimal places, if needed.)R2 = (b) Estimate the value of σ. (Round your answer to three decimal places, if needed.)se = (c) Calculate adjusted R2. (Round your answer to four decimal places, if needed.)Adjusted R2 = Adjusted R2…arrow_forwardLet s be a person's annual salary (in thousands of dollars) after she has worked for t years at a company. Some pairs of values of t and s are shown in the table below. t (years) 0 1 3 6 s (thousands of dollars) 54 57 63 72 a) Create a scattergram of the data. b) Draw in a linear model on the same grid. c) Use your graph to estimate when the person's salary will be $66 thousand. (Show your work on the graph.) d) What is the s-intercept of the model? Interpret it in terms of this application.arrow_forwardGiven the data as shown in the table below X Y 2 12 10 4 10 Use technology to graph the scatterplot and the best-fit line of the data. Find your corect graph belowarrow_forward
arrow_back_ios
arrow_forward_ios
Recommended textbooks for you
- Advanced Engineering MathematicsAdvanced MathISBN:9780470458365Author:Erwin KreyszigPublisher:Wiley, John & Sons, Incorporated
 Numerical Methods for EngineersAdvanced MathISBN:9780073397924Author:Steven C. Chapra Dr., Raymond P. CanalePublisher:McGraw-Hill Education
 Introductory Mathematics for Engineering Applicat...Advanced MathISBN:9781118141809Author:Nathan KlingbeilPublisher:WILEY
  Mathematics For Machine TechnologyAdvanced MathISBN:9781337798310Author:Peterson, John.Publisher:Cengage Learning,

Advanced Engineering Mathematics
Advanced Math
ISBN:9780470458365
Author:Erwin Kreyszig
Publisher:Wiley, John & Sons, Incorporated
Numerical Methods for Engineers
Advanced Math
ISBN:9780073397924
Author:Steven C. Chapra Dr., Raymond P. Canale
Publisher:McGraw-Hill Education
Introductory Mathematics for Engineering Applicat...
Advanced Math
ISBN:9781118141809
Author:Nathan Klingbeil
Publisher:WILEY
Mathematics For Machine Technology
Advanced Math
ISBN:9781337798310
Author:Peterson, John.
Publisher:Cengage Learning,