Question
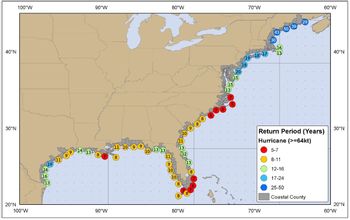
1. Which category provided (5–7 or 25–50) would indicate that an area will frequently experience hurricanes? Explain what these recurrence intervals mean.

Transcribed Image Text:40°N
30°N
20°N
100°W
100°W
19
(16)
16
(13)
(11
14 13
90°W
8 7
90°W
11 1099
8
10-13 13
80°W
(11)
9
10
10
11
(13)
8
(10)
8
12
80°W
13
8
8
8
8
15
13
20
15
70°W
19 18 17
18
43
70°W
30
16
13
50139
29
60°W
Return Period (Years)
Hurricane (>=64kt)
5-7
8-11
12-16
17-24
25-50
Coastal County
40°N
30°N
20°N
60°W
SAVE
AI-Generated Solution
info
AI-generated content may present inaccurate or offensive content that does not represent bartleby’s views.
Unlock instant AI solutions
Tap the button
to generate a solution
to generate a solution
Click the button to generate
a solution
a solution
Knowledge Booster
Similar questions
- Out of the following age groups , which has changed significantly the most over time in the United States? A) ages under 5 years B) ages above 80 years C) ages 25 to 34 years D) ages 35 to 44 yearsarrow_forward8. Various studies in terrestrial and aquatic habitats (e.g. stream invertebrates) suggest that species richness is highest in communities where disturbances are (A) very frequent and severe, (B) very frequent and of moderate intensity, (C) very rare and severe, (D) of intermediate frequency and moderate intensity, (E) very rare and mild.arrow_forwardWhy B is correctarrow_forward
- Even at temperatures as low as 75° F conditions can reach cautionary levels after two consecutive days. What relative humidity level must be reached for a 75° F day to reach the caution zone?arrow_forward14. Label the phases and annotate any important events or features. ニarrow_forward☐ 17. (07.08 MC) The prairie chicken was once widely seen in many areas across the Great Plains. Due to the conversion of prairie land into farmland, one species of the prairie chicken became extinct. The only species of prairie chicken left are endangered mainly because of habitat loss. They require tall grass prairies as their habitat. Which of the following is the best explanation for their endangered state? (4 points) The prairie chickens lack genetic diversity and resilience to changes in environment, resulting decline of the population. Environmental perturbations increased the rate of adaptive alleles. The prairie chickens have adapted to many new environments. The prairie chickens are genetically diverse and resilient to environmental perturbations.arrow_forward
- 13.arrow_forward3. Explain why it is common practice to also collect information about the physical environment when sampling populations: Quadrat 5 Quadrat 4 Quadrat 3 Quadrat 2 Quadrat 1 0 QUADRAT Height/m Light / arbitrary units Humidity / percent Temperature / °C 1 0.4 40 99 2 0.8 56 88 3 1.2 80 50 Percentage cover 68 72 76 14.3 14.2 Kichen 12.1 12.2 13 4 5 1.6 2.0 72 78 intain: 100 Red stem moss Fern moss Snake moss Star moss Eye brow moss Broad leaved star moss Tree moss Lichens (various species) 4. The figure (above) shows the changes in vegetation cover along a 2 m vertical transect up the trunk of an oak tree (Quercus). Changes in the physical factors light, humidity, and temperature along the same transect were also recorded. From what you know about the ecology of mosses and lichens, account for the observed vegetation distribution:arrow_forwardDiscuss various consequences of increase in population density.arrow_forward
- Identify if this is a rate, a ratio, or a proportion. mumber of women in Brgy.Haritan who died from heart disease in 2004 number of women in Brgy.Baritan who died from cancer in 2004 O Proportion Rate O Ratioarrow_forward39. Mites are common pests on individual fence lizards. Mites are observed to bite fence lizards to draw a blood meal, which increases mite population growth rates. Fence lizards respond by scratching their heads to remove mites. The population growth rate of fence lizards is not impacted by this interaction although it appears to be negative for the fence lizards that have mites. What is the best explanation to account for the population growth pattern in fence lizards. a. the interaction is a +, - interaction b. the interaction is at the organism level c. the interaction is a altruism d. the interaction is at the population level e. the interaction is a mutualismarrow_forwardJul 2013 Jan 2014 Jul 2014 Jan 2015 Jul 2015 Jan 2016 Jul 2016 1.00 1.00 Bahia 0.40 A 1.00 1.00 B 0.83 0.91 0.96 Mid 2016 Mid 2015 Early 2013 Early 2014 SA1 CB1 RJ1 0.82 C 0.99 1.00 1.00 Polynesia NE Brazil SE Brazil N Brazil CA1 RJ2 0.95 0.52 Caribbean Central America South America CB2 RJ3 TO SP1 O This study * Microcephaly Faria et al., 2017 Nature RJ4 1.00 0.99 This figure shows a phylogenetic tree of Zika virus sampled in people in Polynesia and Latin America. The tree is turned 90 degrees so that the branches are vertical instead of horizontal, but that is just a style preference of the authors. From this phylogenetic tree, when was Zika virus estimated to have emerged in South and Central America (including Brazil, Caribbean)? SA2 The branch lengths of the phylogenetic tree are scaled by time (time is on y-axis), the tips are positioned at their sampling date. Zika virus was sampled in Polynesia in 2013-January 2014 and these Polynesian samples are indicated in grey. Zika virus…arrow_forward
arrow_back_ios
SEE MORE QUESTIONS
arrow_forward_ios