
Practical Management Science
6th Edition
ISBN: 9781337406659
Author: WINSTON, Wayne L.
Publisher: Cengage,
expand_more
expand_more
format_list_bulleted
Related questions
Question
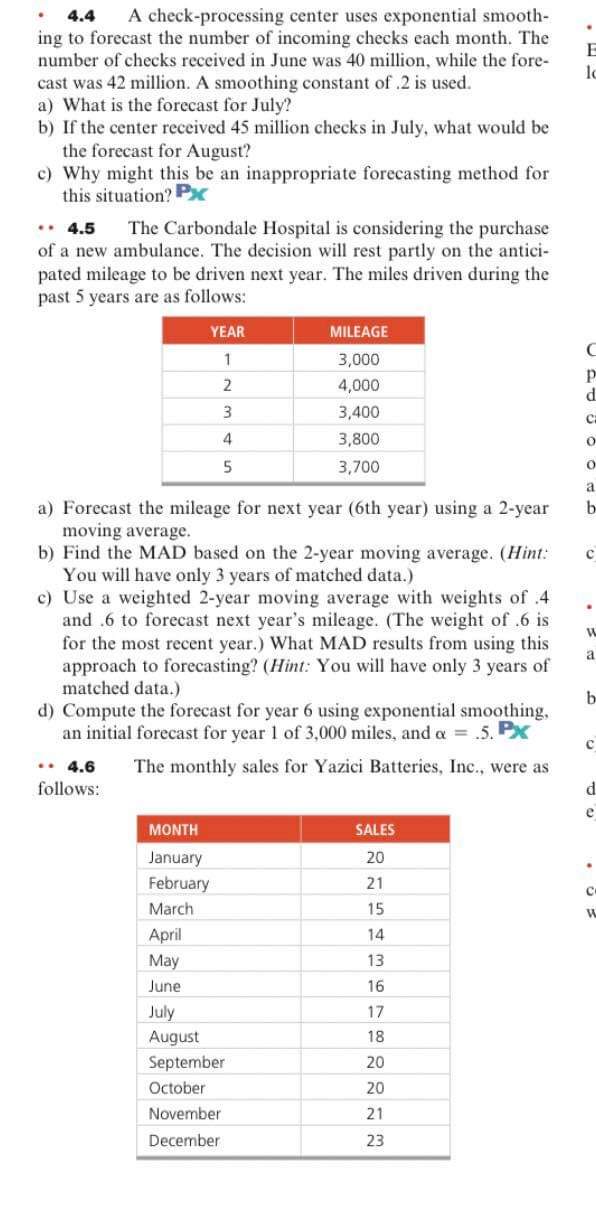

Transcribed Image Text:4.4 A check-processing center uses exponential smooth-
ing to forecast the number of incoming checks each month. The
number of checks received in June was 40 million, while the fore-
cast was 42 million. A smoothing constant of .2 is used.
a) What is the forecast for July?
b) If the center received 45 million checks in July, what would be
the forecast for August?
c) Why might this be an inappropriate forecasting method for
this situation? Px
.. 4.5 The Carbondale Hospital is considering the purchase
of a new ambulance. The decision will rest partly on the antici-
pated mileage to be driven next year. The miles driven during the
past 5 years are as follows:
YEAR
1
2
3
4
5
a) Forecast the mileage for next year (6th year) using a 2-year
moving average.
b) Find the MAD based on the 2-year moving average. (Hint:
You will have only 3 years of matched data.)
c) Use a weighted 2-year moving average with weights of 4
and .6 to forecast next year's mileage. (The weight of .6 is
for the most recent year.) What MAD results from using this
approach to forecasting? (Hint: You will have only 3 years of
matched data.)
MILEAGE
3,000
4,000
3,400
3,800
3,700
d) Compute the forecast for year 6 using exponential smoothing,
an initial forecast for year 1 of 3,000 miles, and a 5. Px
4.6 The monthly sales for Yazici Batteries, Inc., were as
follows:
MONTH
January
February
March
April
May
June
July
August
September
October
November
December
SALES
20
21
15
14
13
16
17
18
20
20
21
23
E
lo
C
P
d
C
0
0
a
b
C
.
W
a
b
C
d
e
.
C
W

Transcribed Image Text:a) Plot the monthly sales data.
b) Forecast January sales using each of the following:
i) Naive method.
ii) A 3-month moving average.
iii) A 6-month weighted average using .1, 1, 1, 2, .2, and 3.
with the heaviest weights applied to the most recent months.
iv) Exponential smoothing using an a = .3 and a September
forecast of 18.
v) A trend projection.
c) With the data given, which method would allow you to fore-
cast next March's sales? P
.. 4.7 The actual demand for the patients at Omaha
Emergency Medical Clinic for the first 6 weeks of this year fol-
lows:
WEEK
1
2
3
4
5
6
Clinic administrator Marc Schniederjans wants you to forecast
patient demand at the clinic for week 7 by using this data. You
decide to use a weighted moving average method to find this fore-
cast. Your method uses four actual demand levels, with weights
of 0.333 on the present period, 0.25 one period ago, 0.25 two peri-
ods ago, and 0.167 three periods ago.
a) What is the value of your forecast? Px
b) If instead the weights were 20, 15, 15, and 10, respectively, how
would the forecast change? Explain why.
c) What if the weights were 0.40, 0.30, 0.20, and 0.10, respec-
tively? Now what is the forecast for week 7?
.
4.8 Daily high temperatures in St. Louis for the last week
were as follows: 93, 94, 93, 95, 96, 88, 90 (yesterday).
a) Forecast the high temperature today, using a 3-day moving
average.
b) Forecast the high temperature today, using a 2-day moving
average.
c) Calculate the mean absolute deviation based on a 2-day mov-
ing average.
d) Compute the mean squared error for the 2-day moving average.
e) Calculate the mean absolute percent error for the 2-day mov-
ing average. P
ACTUAL NO. OF
PATIENTS
65
62
70
48
63
52
4.9 Lenovo uses the ZX-81 chip in some of its laptop
computers. The prices for the chip during the past 12 months.
were as follows:
MONTH
January
February
March
April
May
June
PRICE PER
CHIP
$1.801 July
1.67
1.70
1.85
1.90
1.87
MONTH
August
September
October
November
December
PRICE PER
CHIP
1.80
1.83
1.70
1.65
1.70
1.75
Expert Solution
This question has been solved!
Explore an expertly crafted, step-by-step solution for a thorough understanding of key concepts.

This is a popular solution

Trending nowThis is a popular solution!

Step by stepSolved in 2 steps with 1 images

Knowledge Booster

Similar questions
- An electrical contractor's records during the last five weeks indicate the number of job requests: Week: Requests: 1 2 3 5 25 27 25 26 27 Click here for the Excel Data File Predict the number of requests for week 6 using each of these methods: a. Naive. Number of requests b. A four-perlod moving average. (Round your answer to 2 decimal places.) Number of requestsarrow_forwardFORECASTING- EXPONENTIAL SMOOTHING QUESTION 3 PERIOD АCTUAL 1 42 2 40 3 43 4 40 5 41 39 7 46 8 44 9. 45 10 38 11 40 12 a) Consider exponential smoothing forecasts using smoothing constants (a) 0.1 and 0.4arrow_forwardeBook Problem 6-05 Consider the following time series data. 3 16 Week 1 Week 2 Value 18 13 a. Choose the correct time series plot (1) € (!!!) Time Series Value Time Series Value 28642986420 284H2G86420 1 4 11 2 {B} 2 TH 3 Week (t) Week (t) 5 6 € (iv) Time Series Value Time Series Value 28642 NO 28642 NO 1 2 2 4 3₁ Week (t) Week (t) 5 6arrow_forward
- Nonearrow_forwardHere are the data for the past 21 months for actual sales of a particular product: LAST YEAR THIS YEAR January 315 February 418 March 390 April 430 May 400 [ June 480 July 430 August 320 September 385 October 530 November 592 555 December 300 400 350 460 390 395 355 245 340 Develop a forecast for the fourth quarter using a three-quarter, weighted moving average. Weight the most recent quarter 0.50, the second most recent 0.25, and the third 0.25. Do the problem using quarters, as opposed to forecasting separate months. (Round your answer to 2 decimal places.) Forecast for the fourth quarterarrow_forward(4) Exponential smoothing with a smoothing constant equal to 0.15, assuming a March forecast of 15(000). (Round your intermediate forecast values and final answer to 2 decimal places.) Forecast thousands (5) A linear trend equation. (Round your intermediate calculations and final answer to 2 decimal places.) Yt thousandsarrow_forward
- Asvnch Problem - Statistical Forecasting Data Set – Eunice BC Fashion Monthly Sales, in million units. Year Total Sales Year Total Sales 2010 38 2016 43 2011 41 2017 40 2012 40 2018 45 2013 45 2019 47 2014 50 2020 42 2015 42 2021 48 Questions: a. Find the naïve forecast. b. Use the 3 years moving average forecast. c. Have a 5 years weighted moving average. d. Develop forecast using exponential smoothing with a = 0.2. e. Determine the trend line equation and present the forecast. f. Find the best forecast for year 2022. Note: Use the first 5 years as the training samples and the last 5 years as the forecasting samples. Solve it in Excel Sheet/Sheet with Equations as possible.arrow_forwardPeriod 1 2 3 4 5 New Accounts Period 201 215 212 229 236 6 7 8 9 10 New Accounts Period 233 249 253 254 268 11 12 13 14 15 New Accounts 282 276 281 289 311arrow_forwardA forecasting method has produced the following over the past five months. What is the mean absolute percentage error (MAPE)? Actual 11 OA. 0.00% B. 31.87% 5178 11 13 Forecast 13 10 30668 $7arrow_forward
- a. What is the mean square error for time periods 2 through 4 using the average forecasting method? b. What is the mean absolute error for time periods 2 through 4 using the average forecasting method? c. What is the mean absolute percentage error for time period 2 through 4 using the average forecasting method? Round all answers to two decimal places. Time Period 1 2 3 4 Mean absolute error (MAE) Mean squared error (MSE) Mean absolute percentage error (MAPE) Electric Bill 510 315 420 480 Average Forecast Forecast Errorarrow_forward9arrow_forwardAssume that your stock of sales merchandise is maintained based on the forecast demand. If the distributor's sales personnel call on the first day of each month, compute your forecast sales by each of the three methods requested here. June July August ACTUAL 144 184 210 a. Using a simple three-month moving average, what is the forecast for September? Note: Round your answer to 2 decimal places. Forecast for September b. Using a weighted moving average, what is the forecast for September with weights of 0.30, 0.40, and 0.30 for June, July, and August, respectively? Note: Do not round intermediate calculations. Round your answer to 2 decimal places. Forecast for Septemberarrow_forward
arrow_back_ios
SEE MORE QUESTIONS
arrow_forward_ios
Recommended textbooks for you
- Practical Management ScienceOperations ManagementISBN:9781337406659Author:WINSTON, Wayne L.Publisher:Cengage,
 Operations ManagementOperations ManagementISBN:9781259667473Author:William J StevensonPublisher:McGraw-Hill Education
 Operations and Supply Chain Management (Mcgraw-hi...Operations ManagementISBN:9781259666100Author:F. Robert Jacobs, Richard B ChasePublisher:McGraw-Hill Education
 Purchasing and Supply Chain ManagementOperations ManagementISBN:9781285869681Author:Robert M. Monczka, Robert B. Handfield, Larry C. Giunipero, James L. PattersonPublisher:Cengage Learning
 Production and Operations Analysis, Seventh Editi...Operations ManagementISBN:9781478623069Author:Steven Nahmias, Tava Lennon OlsenPublisher:Waveland Press, Inc.
Practical Management Science
Operations Management
ISBN:9781337406659
Author:WINSTON, Wayne L.
Publisher:Cengage,
Operations Management
Operations Management
ISBN:9781259667473
Author:William J Stevenson
Publisher:McGraw-Hill Education
Operations and Supply Chain Management (Mcgraw-hi...
Operations Management
ISBN:9781259666100
Author:F. Robert Jacobs, Richard B Chase
Publisher:McGraw-Hill Education
Purchasing and Supply Chain Management
Operations Management
ISBN:9781285869681
Author:Robert M. Monczka, Robert B. Handfield, Larry C. Giunipero, James L. Patterson
Publisher:Cengage Learning
Production and Operations Analysis, Seventh Editi...
Operations Management
ISBN:9781478623069
Author:Steven Nahmias, Tava Lennon Olsen
Publisher:Waveland Press, Inc.