
MATLAB: An Introduction with Applications
6th Edition
ISBN: 9781119256830
Author: Amos Gilat
Publisher: John Wiley & Sons Inc
expand_more
expand_more
format_list_bulleted
Related questions
Question
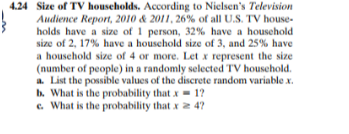

Transcribed Image Text:4.24 Size of TV households. According to Nielsen's Television
Audience Report, 2010 & 2011, 26% of all U.S. TV house-
holds have a size of 1 person, 32% have a houschold
size of 2, 17% have a houschold size of 3, and 25% have
a household size of 4 or more. Let x represent the size
(number of people) in a randomly selected TV household.
a. List the possible values of the discrete random variable x.
b. What is the probability that x = 1?
e. What is the probability that x 2 4?
Expert Solution
arrow_forward
Step 1


Trending nowThis is a popular solution!

Step by stepSolved in 2 steps with 2 images

Knowledge Booster

Similar questions
- In a memory test, the test subjects are given a large number and are asked to memorize it. Historical records show that 80% of test subjects pass the test. To pass the test, a subject must exactly repeat all the digits in the number after two hours. A random sample of 625 people to take the memory test is going to be chosen. Let p be the proportion of people in the sample who pass the test. Answer the following. (If necessary, consult a list of formulas.) (a) Find the mean of P. 0 (b) Find the standard deviation of p. 0 (c) Compute an approximation for P(P >0.84), which is the probability that more than 84% of the people in the sample pass the test. Round your answer to four decimal places. 0 Xarrow_forward20. 3 Venn diagramarrow_forwardAdela Noriegam, a researcher wants to determine how employee salaries at a certain company are related to the length of employment, previous experience, and education. The researcher selects eight employees from the company and obtains the following data: Employee Salary,y Employment (in yrs), x1 Employment (in yrs), x2 Employment (in yrs), x3 A 57310 10 2 16 B 57380 5 6 16 C 54135 4 1 12 D 56985 6 5 14 E 58715 8 8 16 F 60000 20 0 12 G 59400 9 4 18 H 60720 15 7 17 What is the regression equation? Leave your answer in 2 decimal places Y = ()+() +() +arrow_forward
- 6arrow_forwardDoes the location of your seat in a classroom play a role in attendance or grade? 1600 students in a physics course were randomly assigned to one of four groups. The 400 students in group 1 sat 0 to 4 meters from the front of the class, the 400 students in group 2 sat 4 to 6.5 meters from the front, the 400 students in group 3 sat 6.5 to 9 meters from the front, and the 400 students in group 4 sat 9 to 12 meters from the front. Complete parts (a) through (c). Click the icon to view the chi-square table of critical values. (a) For the first half of the semester, the attendance for the whole class averaged 83%. So, if there is no effect due to seat location, we would expect 83% of students in each group to attend. The data show the attendance history for each group. How many students in each group attended, on average? Is there a significant difference among the groups in attendance patterns? 3 4 Group Attendance 1 0.84 0.84 0.84 0.80 The number of students who attended in the first…arrow_forward5arrow_forward
- An experiment investigated the effect of length and repetition of TV ads on students choosing to eat at Del Taco. All 60 students watched a 40-minute television program that included ads for Del Taco. Some students saw a 30-second commerical; others a 90-second commerical. The same commerical was shown either 1, 3, or 5 times during the program. After the viewing, each student was asked to rate their craving for Del Taco on a scale of 0 to 10. What are the subjects of this experiment?A. 60 studentsB. effect of length and repetion of TV adsC. 40-minute television programD. craving for Del Taco on a scale of 0 to 10E. 1, 3, or 5 commercials during the 40-minute television programarrow_forwardAn experiment investigated the effect of length and repetition of TV ads on students choosing to eat at Del Taco. All 60 students watched a 40-minute television program that included ads for Del Taco. Some students saw a 30-second commerical; others a 90-second commerical. The same commerical was shown either 1, 3, or 5 times during the program. After the viewing, each student was asked to rate their craving for Del Taco on a scale of 0 to 10. What is the response variable?A. 1, 3, or 5 commercials during the 40-minute television programB. craving for Del Taco on a scale of 0 to 10C. 60 studentsD. 30-second and 90-second commericialsE. 40-minute television programarrow_forwardSuperpowers A total of 415 children from the United Kingdom and the United States who completed a survey in a recent year were randomly selected. Each student's country of origin was recorded along with which superpower they would most like to have: the ability to fly, ability to freeze time, invisibility, superstrength, or telepathy (ability to read minds). The data are summarized in the following table. Country U.K. U.S. Fly 54 45 Freeze time 52 44 Invisibility 30 37 Superpower 20 23 Superstrength Telepathy 44 66 a. What proportion of students in the sample are from the United States? b. Find the distribution of superpower preference for the students in the sample using relative frequencies. c. What percent of students in the sample are from the United Kingdom and prefer telepathy as their superpower preference?arrow_forward
- Twenty students in a group of 40 at Dawn High elect for a course in statistics (St. Eleven students take up linear algebra (L). Five students enrolled for both courses. Represent the data in the Venn diagram below.arrow_forwardUSE EXCEL to solve this problem. Thanks.arrow_forwardA manufacturing plant makes computer chips 24 hours a day. Employees work one of three, 8 hour shifts during the morning (2am-10am), day (10am-6pm), and night (6pm-2am). Below are data on the number of defective chips on a randomly chosen 24 hour period. Shift Morning Day Night Number of Defective Chips 23 26 47 Total Chips Manufactured 330 330 330 The plant manager thinks there might be more defective computer chips manufactured during the night shift compared to the day shift. Give appropriate statistical evidence to test the managers' claim.arrow_forward
arrow_back_ios
SEE MORE QUESTIONS
arrow_forward_ios
Recommended textbooks for you
- MATLAB: An Introduction with ApplicationsStatisticsISBN:9781119256830Author:Amos GilatPublisher:John Wiley & Sons Inc
 Probability and Statistics for Engineering and th...StatisticsISBN:9781305251809Author:Jay L. DevorePublisher:Cengage Learning
 Statistics for The Behavioral Sciences (MindTap C...StatisticsISBN:9781305504912Author:Frederick J Gravetter, Larry B. WallnauPublisher:Cengage Learning
  Elementary Statistics: Picturing the World (7th E...StatisticsISBN:9780134683416Author:Ron Larson, Betsy FarberPublisher:PEARSON
 The Basic Practice of StatisticsStatisticsISBN:9781319042578Author:David S. Moore, William I. Notz, Michael A. FlignerPublisher:W. H. Freeman
 Introduction to the Practice of StatisticsStatisticsISBN:9781319013387Author:David S. Moore, George P. McCabe, Bruce A. CraigPublisher:W. H. Freeman
MATLAB: An Introduction with Applications
Statistics
ISBN:9781119256830
Author:Amos Gilat
Publisher:John Wiley & Sons Inc
Probability and Statistics for Engineering and th...
Statistics
ISBN:9781305251809
Author:Jay L. Devore
Publisher:Cengage Learning
Statistics for The Behavioral Sciences (MindTap C...
Statistics
ISBN:9781305504912
Author:Frederick J Gravetter, Larry B. Wallnau
Publisher:Cengage Learning
Elementary Statistics: Picturing the World (7th E...
Statistics
ISBN:9780134683416
Author:Ron Larson, Betsy Farber
Publisher:PEARSON
The Basic Practice of Statistics
Statistics
ISBN:9781319042578
Author:David S. Moore, William I. Notz, Michael A. Fligner
Publisher:W. H. Freeman
Introduction to the Practice of Statistics
Statistics
ISBN:9781319013387
Author:David S. Moore, George P. McCabe, Bruce A. Craig
Publisher:W. H. Freeman