Advanced Engineering Mathematics
10th Edition
ISBN: 9780470458365
Author: Erwin Kreyszig
Publisher: Wiley, John & Sons, Incorporated
expand_more
expand_more
format_list_bulleted
Question
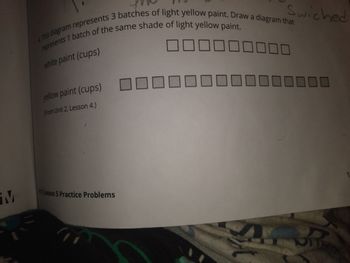
This diagram of represents three batches of light yellow paint draw a diagram that represents one batch of the same shade of light yellow paint.

Transcribed Image Text:4. This diagram represents 3 batches of light yellow paint. Draw a diagram that
represents 1 batch of the same shade of light yellow paint.
000000000
white paint (cups)
000000000000000
yellow paint (cups)
(From Unit 2, Lesson 4.)
wiched

Transcribed Image Text:M
4. This diagram represents 3 batches of light yellow paint. Draw a diagram that
represents 1 batch of the same shade of light yellow paint.
white paint (cups)
yellow paint (cups)
(From Unit 2, Lesson 4.)
Swiched
2 Lesson 5 Practice Problems
Expert Solution
This question has been solved!
Explore an expertly crafted, step-by-step solution for a thorough understanding of key concepts.
This is a popular solution
Trending nowThis is a popular solution!
Step by stepSolved in 4 steps with 4 images

Knowledge Booster
Similar questions
- On March 11, 2011, Japan suffered an earthquake and tsunami that caused a disastrous accident at the Fukushima nuclear power plant. Among many other results, amounts of iodine-131 that were 27 times the government limit were found in a sample of spinach 60 miles away.† Now, 27 times the government limit of iodine-131 is 54 thousand becquerels per kilogram.† The following table shows the amount I, in thousands of becquerels per kilogram, of iodine-131 that would remain after t days. t = time, in days I = amount ofiodine-131 0 54.00 1 49.52 2 45.41 3 41.64 4 38.18 (a) Show that the data are exponential. (In this part and the next, round to three decimal places.) Because t increases by 1 each time, to show that the data are exponential, we must show that the successive ratios (rounded to three decimal places) are the same. Because all of the ratios are equal to , the data are exponential. (b) Find an exponential model I that shows the amount of iodine-131…arrow_forwardWhat program did you use to type in your code to create the graph?arrow_forwardThree products were used in a hot summer to keep the pool chlorine level high. Each product was used in 6 pools, and there was a total of 18 pools in the experiment. The same amount of chlorine was added to each pool (A, B, or C) and the conditions such as pool size, temperature, sun exposure etc. were similar. The chlorine levels (%) were measured and recorded after 24 hours of using the products. The percentages in the table below are the percentage of the chlorine added to the pool remaining after this 24 hours. The data is as follows: A 96 56 52 66 70 60 B 44 36 34 50 40 48 с 723227 34 40 20 24 a) Find the overall mean of the chlorine level across all the pools measured, and then find the mean of the chlorine level for each product.arrow_forward
- PLEASE ANSWER ALL PARTS OF THE QUESTION AND USE THE IMAGE FOR A GUIDE A biologist is studying the effect of fertilizer on a species of endangered plant in a specific area of land divided into 32 equal sized plots. (See diagram.) Plots numbered 1—16 are in deep shade from the trees for most of the day while periodic flooding occurs in the areas numbered 17—32. The biologist chooses 16 plots at random and applies organic fertilizer. The other plots receive non-organic fertilizer. At the end of the study period, the percentage increase in the number of this plant is measured in each plot and compared for each type of fertilizer. Is this an experiment? Briefly explain your answer. A biologist is studying the effect of fertilizer on a species of endangered plant in a specific area of land divided into 32 equal sized plots. (See diagram.) Plots numbered 1—16 are in deep shade from the trees for most of the day while periodic flooding occurs in the areas…arrow_forwardpart (iii)arrow_forwardHelp please!arrow_forward
- Below are the first five letters of the alphabet, designed to fit the vertices of a grid. Below them in subparts (a) through (d) are the first four letters that were designed on other grids. Draw the "e" that goes with each type style, or font. As stated many times in this book, we want you to go beyond random trial and error. First, take some time and think. One strategy is to try to write the rules that the writer of the letter used. Another strategy is to try to articulate the common characteristics of the four letters.t abcde (a) (b) (c) تحاد EEEE abcd. BA م داد plo EEEE 0arrow_forwardPlease draw a scatterplot that would describe a positive association and then a separate one that would describe a negative association.arrow_forward
arrow_back_ios
arrow_forward_ios
Recommended textbooks for you
 Advanced Engineering MathematicsAdvanced MathISBN:9780470458365Author:Erwin KreyszigPublisher:Wiley, John & Sons, Incorporated
 Numerical Methods for EngineersAdvanced MathISBN:9780073397924Author:Steven C. Chapra Dr., Raymond P. CanalePublisher:McGraw-Hill Education
 Introductory Mathematics for Engineering Applicat...Advanced MathISBN:9781118141809Author:Nathan KlingbeilPublisher:WILEY
 Mathematics For Machine TechnologyAdvanced MathISBN:9781337798310Author:Peterson, John.Publisher:Cengage Learning,


Advanced Engineering Mathematics
Advanced Math
ISBN:9780470458365
Author:Erwin Kreyszig
Publisher:Wiley, John & Sons, Incorporated

Numerical Methods for Engineers
Advanced Math
ISBN:9780073397924
Author:Steven C. Chapra Dr., Raymond P. Canale
Publisher:McGraw-Hill Education

Introductory Mathematics for Engineering Applicat...
Advanced Math
ISBN:9781118141809
Author:Nathan Klingbeil
Publisher:WILEY

Mathematics For Machine Technology
Advanced Math
ISBN:9781337798310
Author:Peterson, John.
Publisher:Cengage Learning,

