Holt Mcdougal Larson Pre-algebra: Student Edition 2012
1st Edition
ISBN: 9780547587776
Author: HOLT MCDOUGAL
Publisher: HOLT MCDOUGAL
expand_more
expand_more
format_list_bulleted
Concept explainers
Topic Video
Question
thumb_up100%
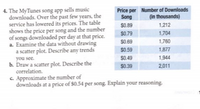
The MyTunes song app sells music
C only thank you.

Transcribed Image Text:4. The MyTunes song app sells music
downloads. Over the past few years, the
service has lowered its prices. The table
shows the price per song and the number
of songs downloaded per day at that price.
a. Examine the data without drawing
a scatter plot. Describe any trends
you see.
b. Draw a scatter plot. Describe the
correlation.
C. Approximate the number of
downloads at a price of $0.54 per song. Explain your reasoning.
Price per Number of Downloads
Song
(in thousands)
$0.89
1,212
$0.79
1,704
$0.69
1,760
$0.59
1,877
$0.49
1,944
$0.39
2,011
Expert Solution
This question has been solved!
Explore an expertly crafted, step-by-step solution for a thorough understanding of key concepts.
This is a popular solution
Trending nowThis is a popular solution!
Step by stepSolved in 2 steps with 2 images

Knowledge Booster
Learn more about
Need a deep-dive on the concept behind this application? Look no further. Learn more about this topic, algebra and related others by exploring similar questions and additional content below.Similar questions
- Answer the circled onesarrow_forwardThe Toyota Camry is one of the best-selling cars in North America. The cost of a previously owned Camry depends on many factors, including the model year, mileage, and condition. To investigate the relationship between the car's mileage and the sales price for Camrys, the following data show the mileage and sale price for 19 sales (PriceHub web site, February 24, 2012). DATA file Miles (1,000s) Price ($1,000s) 22 16.2 29 16.0 36 13.8 47 11.5 63 12.5 77 12.9 73 11.2 87 13.0 92 11.8 101 10.8 110 8.3 28 12.5 59 11.1 68 15.0 68 12.2 91 13.0 42 15.6 65 12.7 110 8.3arrow_forwarda. Complete the rate table. Number of Peppers 1 15 20 100 4 10 Cost 2.25 b. How many peppers could you buy for $20? c. Describe what the graph of this data would look like and name a point on the graph.arrow_forward
- Do the plots show any trend? If yes, is the trend,Why or why not?arrow_forwardSuppose an Internet retailer would like to investigate the relationship between the amount of time in minutes a purchaser spends on its Web site and the amount of money he or she spends on an order. The accompanying table shows the data from a random sample of 12 customers. Construct a scatter plot using these data. Describe the relationship between the amount of time in minutes a purchaser spends on its Web site and the amount of money he or she spends on an order. Click the icon to view the table. Construct a scatter plot using these data. Choose the correct graph below. A. 120 Minutes Order Size ($) B. Order Size ($) 400- Minutes 40 Q O C. Time spent versus order size 15 18 24 30 24 16 10 16 36 9 24 36 Order Size ($) Time (minutes) Order Size (S) 199 230 20 62 343 176 225 354 370 71 400 47 Print Done Minutes Q X Order Size ($) D. Minutes 40 Q OUarrow_forwardPart a through e please. Thank you!arrow_forward
- Make a step by step Scatterplot of screen size vs. price. Explain in one sentence, does there appear to be a positive or a negative correlation between price and screen size? Paste a snapshot of the plot here. Please do not copy paste. How to take snapshots: if you use a MacBook, press Command+ Shift+4 to take snapshots. If you are using Windows, use the Snipping Tool to take snapshots. What is the value of correlation coefficient between screen size and price? Discuss the direction of the relationship (positive, negative, or zero relationship). Also discuss the strength of the relationship. Question 1: Estimate the relationship between screen size and price using a simple linear regression model and interpret the estimated coefficients. In your interpretation, tell the dollar amount by which price will change for each unit of increase in screen size. (The answer for the second part of this question will come from coefficients of screen size) Include the manufacturer dummy variable…arrow_forwardThe accompanying table displays information about the number of births (in thousands) and the number of deaths (in thousands) for certain years. Report the death rate as a percentage of the birth rate, and comment on its trend over time. What is causing the trend? LOADING... Click the icon to view the data table. Report each death rate as a percentage of the birth rate. Year Births (thousands) Deaths (thousands) Percentage of deaths per births 2006 4275 2445 nothing% 2007 4320 2408 nothing% 2008 4241 2465 nothing% 2009 4140 2436 nothing% 2010 4002 2455 nothing% (Round to one decimal place as needed.)arrow_forwardA car dealership is analyzing the changes in its monthly sales. They sold 40 cars in March, 55 in April, 61 in May, 29 in June, 63 in July, and 40 in August. Create line graph that represents this data. 3.arrow_forward
- So I'll include a line graph for a second visual aid. I have a chart to show the proportion of students by major that have student loan debt at our school.arrow_forwardWhat would be a suitable chart type to show the proportions of the sales by products?arrow_forwardSee uploaded picture for question.arrow_forward
arrow_back_ios
SEE MORE QUESTIONS
arrow_forward_ios
Recommended textbooks for you
 Holt Mcdougal Larson Pre-algebra: Student Edition...AlgebraISBN:9780547587776Author:HOLT MCDOUGALPublisher:HOLT MCDOUGAL
 Glencoe Algebra 1, Student Edition, 9780079039897...AlgebraISBN:9780079039897Author:CarterPublisher:McGraw Hill

Holt Mcdougal Larson Pre-algebra: Student Edition...
Algebra
ISBN:9780547587776
Author:HOLT MCDOUGAL
Publisher:HOLT MCDOUGAL

Glencoe Algebra 1, Student Edition, 9780079039897...
Algebra
ISBN:9780079039897
Author:Carter
Publisher:McGraw Hill