
MATLAB: An Introduction with Applications
6th Edition
ISBN: 9781119256830
Author: Amos Gilat
Publisher: John Wiley & Sons Inc
expand_more
expand_more
format_list_bulleted
Related questions
Topic Video
Question
Having issues with number 4 can someone help me? It’s One sample T scores
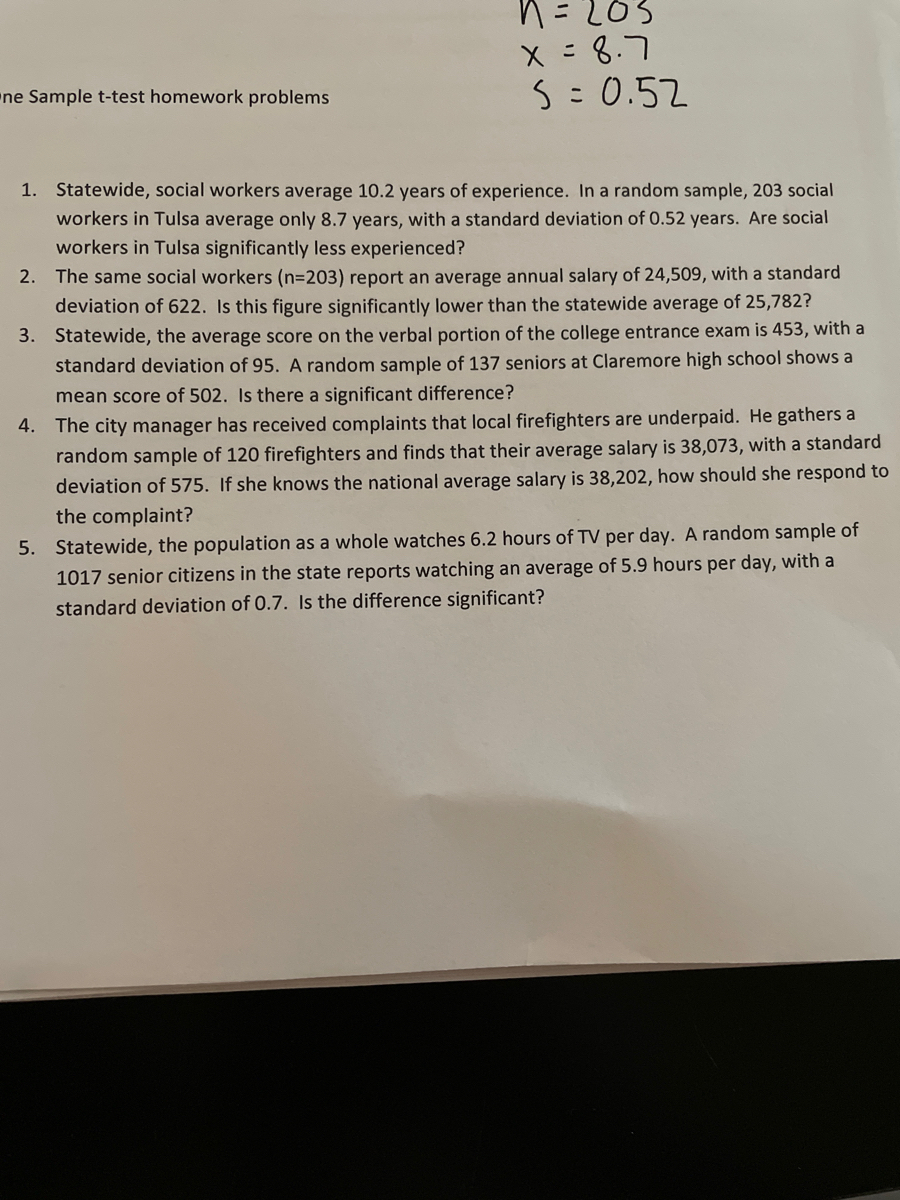

Transcribed Image Text:n=203
X= 8.7
S=0.52
ne Sample t-test homework problems
1. Statewide, social workers average 10.2 years of experience. In a random sample, 203 social
workers in Tulsa average only 8.7 years, with a standard deviation of 0.52 years. Are social
workers in Tulsa significantly less experienced?
2. The same social workers (n=203) report an average annual salary of 24,509, with a standard
deviation of 622. Is this figure significantly lower than the statewide average of 25,782?
3. Statewide, the average score on the verbal portion of the college entrance exam is 453, with a
standard deviation of 95. A random sample of 137 seniors at Claremore high school shows a
mean score of 502. Is there a significant difference?
4. The city manager has received complaints that local firefighters are underpaid. He gathers a
random sample of 120 firefighters and finds that their average salary is 38,073, with a standard
deviation of 575. If she knows the national average salary is 38,202, how should she respond to
the complaint?
5. Statewide, the population as a whole watches 6.2 hours of TV per day. A random sample of
1017 senior citizens in the state reports watching an average of 5.9 hours per day, with a
standard deviation of 0.7. Is the difference significant?
Expert Solution
This question has been solved!
Explore an expertly crafted, step-by-step solution for a thorough understanding of key concepts.

Step by stepSolved in 2 steps

Knowledge Booster


Learn more about
Need a deep-dive on the concept behind this application? Look no further. Learn more about this topic, statistics and related others by exploring similar questions and additional content below.Similar questions
- A researcher wants to know if peoples standardized test performance is influenced by what they are wearing. They ask 16 ppl to take the SAT while wearing their best professional outfit. 6 months later they have the same 16 ppl take the SAT while wearing a bathing suit. What test would you use and why? (z test, independent t test, single sample t test, paired samples)arrow_forwardYou want to test whether a blood pressure medication actually works. You give it to a group of n = 30 patients. You get another group of n=25 patients and give them a placebo. You want to compare the two groups to see whether they have a mean difference in blood pressure. What kind of hypothesis test should you do? One-Sample z-test Independent-Samples t-test Related-Samples t-test One-Sample t-testarrow_forwardhelp please answer in text form with proper workings and explanation for each and every part and steps with concept and introduction no AI no copy paste remember answer must be in proper format with all workingarrow_forward
- Please answer the question in the picture below to answer the question in the other picturearrow_forwardYou want to compare differences in prior arrests across ethnicity in your study, you measured ethnicity as white =0 black =1 hispanic=2, and other =3. Prior arrests was recorded as the number of prior arrests. which test would you perform to see if arrests differ across diffrent ethnic categories? A. ANOVA B. T-testarrow_forwardAt a recent home football game, the Falcons surveyed fans to name their favorite Falcons player. What type of data was collected? Bivariate and Quantitative Bivariate and Categorical Univariate and Quantitative Univariate and Categoricalarrow_forward
- Please help me with both parts a and b of this question! Thank you!arrow_forwardAnxiety when taking math tests is a common problem. If I want to study this issue, which of the following describes the best way to find out the proportion of students who suffer from math anxiety? O Select students who have scored poorly in math classes at CCBC. Poll students as they enter campus on a randomly selected day. Talk to students randomly pulled from the list of all students. Interview students who have finals on the first day of finals week.arrow_forwardFind the z score for population value of 3arrow_forward
arrow_back_ios
arrow_forward_ios
Recommended textbooks for you
- MATLAB: An Introduction with ApplicationsStatisticsISBN:9781119256830Author:Amos GilatPublisher:John Wiley & Sons Inc
 Probability and Statistics for Engineering and th...StatisticsISBN:9781305251809Author:Jay L. DevorePublisher:Cengage Learning
 Statistics for The Behavioral Sciences (MindTap C...StatisticsISBN:9781305504912Author:Frederick J Gravetter, Larry B. WallnauPublisher:Cengage Learning
  Elementary Statistics: Picturing the World (7th E...StatisticsISBN:9780134683416Author:Ron Larson, Betsy FarberPublisher:PEARSON
 The Basic Practice of StatisticsStatisticsISBN:9781319042578Author:David S. Moore, William I. Notz, Michael A. FlignerPublisher:W. H. Freeman
 Introduction to the Practice of StatisticsStatisticsISBN:9781319013387Author:David S. Moore, George P. McCabe, Bruce A. CraigPublisher:W. H. Freeman
MATLAB: An Introduction with Applications
Statistics
ISBN:9781119256830
Author:Amos Gilat
Publisher:John Wiley & Sons Inc
Probability and Statistics for Engineering and th...
Statistics
ISBN:9781305251809
Author:Jay L. Devore
Publisher:Cengage Learning
Statistics for The Behavioral Sciences (MindTap C...
Statistics
ISBN:9781305504912
Author:Frederick J Gravetter, Larry B. Wallnau
Publisher:Cengage Learning
Elementary Statistics: Picturing the World (7th E...
Statistics
ISBN:9780134683416
Author:Ron Larson, Betsy Farber
Publisher:PEARSON
The Basic Practice of Statistics
Statistics
ISBN:9781319042578
Author:David S. Moore, William I. Notz, Michael A. Fligner
Publisher:W. H. Freeman
Introduction to the Practice of Statistics
Statistics
ISBN:9781319013387
Author:David S. Moore, George P. McCabe, Bruce A. Craig
Publisher:W. H. Freeman