MATLAB: An Introduction with Applications
6th Edition
ISBN: 9781119256830
Author: Amos Gilat
Publisher: John Wiley & Sons Inc
expand_more
expand_more
format_list_bulleted
Question
I only need help with second page ... questions 4 5 6

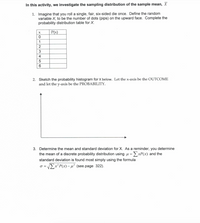
Transcribed Image Text:In this activity, we investigate the sampling distribution of the sample mean, X
1. Imagine that you roll a single, fair, six-sided die once. Define the random
variable X, to be the number of dots (pips) on the upward face. Complete the
probability distribution table for X.
P(x)
1
2
3
4
2. Sketch the probability histogram for x below. Let the x-axis be the OUTCOME
and let the y-axis be the PROBABILITY.
3. Determine the mean and standard deviation for X. As a reminder, you determine
the mean of a discrete probability distribution using u =ExP(x) and the
standard deviation is found most simply using the formula
o = EX²P(x)- µ² (see page 322).
%3D

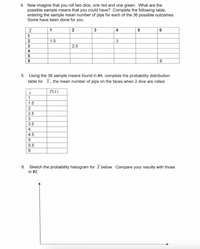
Transcribed Image Text:4. Now imagine that you roll two dice, one red and one green. What are the
possible sample means that you could have? Complete the following table,
entering the sample mean number of pips for each of the 36 possible outcomes.
Some have been done for you.
1
2
3
4
6
1.5
3
3
2.5
4
5
6
5. Using the 36 sample means found in #4, complete the probability distribution
table for X, the mean number of pips on the faces when 2 dice are rolled.
P(x)
1
1.5
2.5
3
3.5
4
4.5
5.5
6. Sketch the probability histogram for X below. Compare your results with those
in #2.
556
Expert Solution
This question has been solved!
Explore an expertly crafted, step-by-step solution for a thorough understanding of key concepts.
Step by stepSolved in 2 steps

Knowledge Booster
Learn more about
Need a deep-dive on the concept behind this application? Look no further. Learn more about this topic, statistics and related others by exploring similar questions and additional content below.Similar questions
- Please show me how to answer in excel. Questions 3-6.arrow_forwardIf figure ABDC is translated right 2 then down 3, what would be the location of B ? -2 0 O 0.-1) 0(4.1) O(4. -1) (5.0) 4)arrow_forwardFor questions 6a-6d, choose Yes or No to tell if the expressions are equivalent. 6a. 7.4 X (12.5 - 8.4) O Yes O No and 7.4 X 4.1 6b. (24- 1.6) ÷ 3.2 O Yes O No and 6.4 3.2 6c. (7.4 + 12.5) - 8.4 O Yes O No and 7.4 + 4.1 6d. 8 X 2.5 - 3.2 O Yes O No and 20 + 4.1arrow_forward
- Which of the following sets of numbers could not represent the three sides of a triangle?arrow_forward2. You are in the center of a square and you walk 5 meters to the right, then 8 meters to the left and finally 6 meters to the right.to. How much distance did you travel?b. How far are you from the center? (Explain)arrow_forwardWhich of the following sets of numbers could not represent the three sides of a triangle?arrow_forward
arrow_back_ios
arrow_forward_ios
Recommended textbooks for you
 MATLAB: An Introduction with ApplicationsStatisticsISBN:9781119256830Author:Amos GilatPublisher:John Wiley & Sons Inc
 Probability and Statistics for Engineering and th...StatisticsISBN:9781305251809Author:Jay L. DevorePublisher:Cengage Learning
 Statistics for The Behavioral Sciences (MindTap C...StatisticsISBN:9781305504912Author:Frederick J Gravetter, Larry B. WallnauPublisher:Cengage Learning
 Elementary Statistics: Picturing the World (7th E...StatisticsISBN:9780134683416Author:Ron Larson, Betsy FarberPublisher:PEARSON
 The Basic Practice of StatisticsStatisticsISBN:9781319042578Author:David S. Moore, William I. Notz, Michael A. FlignerPublisher:W. H. Freeman
 Introduction to the Practice of StatisticsStatisticsISBN:9781319013387Author:David S. Moore, George P. McCabe, Bruce A. CraigPublisher:W. H. Freeman

MATLAB: An Introduction with Applications
Statistics
ISBN:9781119256830
Author:Amos Gilat
Publisher:John Wiley & Sons Inc

Probability and Statistics for Engineering and th...
Statistics
ISBN:9781305251809
Author:Jay L. Devore
Publisher:Cengage Learning

Statistics for The Behavioral Sciences (MindTap C...
Statistics
ISBN:9781305504912
Author:Frederick J Gravetter, Larry B. Wallnau
Publisher:Cengage Learning

Elementary Statistics: Picturing the World (7th E...
Statistics
ISBN:9780134683416
Author:Ron Larson, Betsy Farber
Publisher:PEARSON

The Basic Practice of Statistics
Statistics
ISBN:9781319042578
Author:David S. Moore, William I. Notz, Michael A. Fligner
Publisher:W. H. Freeman

Introduction to the Practice of Statistics
Statistics
ISBN:9781319013387
Author:David S. Moore, George P. McCabe, Bruce A. Craig
Publisher:W. H. Freeman