
MATLAB: An Introduction with Applications
6th Edition
ISBN: 9781119256830
Author: Amos Gilat
Publisher: John Wiley & Sons Inc
expand_more
expand_more
format_list_bulleted
Related questions
Topic Video
Question
I need help with 4, 5, 6 and 7 plz.
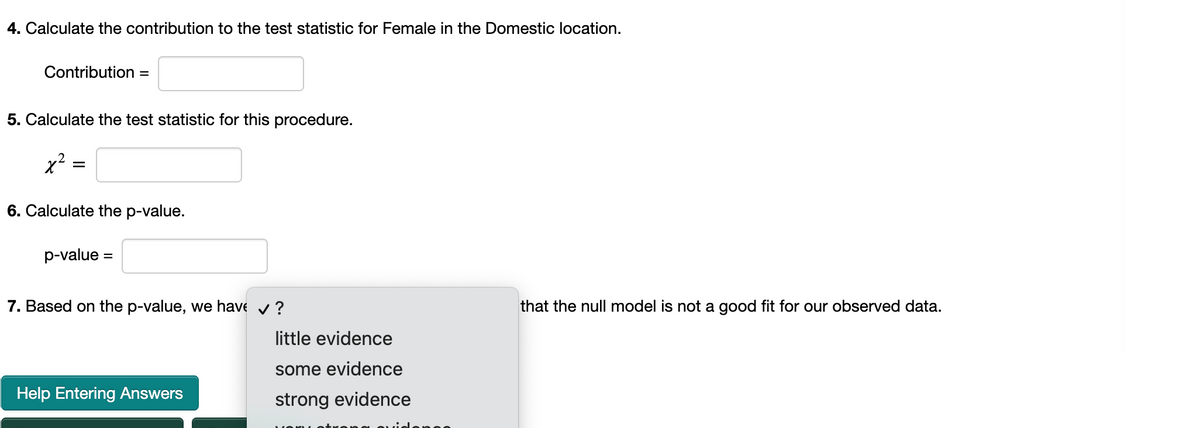

Transcribed Image Text:4. Calculate the contribution to the test statistic for Female in the Domestic location.
Contribution =
5. Calculate the test statistic for this procedure.
6. Calculate the p-value.
p-value =
%3D
7. Based on the p-value, we have v ?
that the null model is not a good fit for our observed data.
little evidence
some evidence
Help Entering Answers
strong evidence

Transcribed Image Text:Sex-role stereotyping - The article “A Cross-Cultural Content Analysis of Sex-Role Stereotyping in Television Advertisements" compares sex-role
stereotyping in British and New Zealand television advertisements. One of the coding or classification procedures involved the Location where the
central figures in the advertisement were depicted. The researchers were interested in determining whether there is an association between Sex of the
central figures and Location where they are depicted in the advertisement. The table below summarize the observed data for Great Britain, consistent
with the article mentioned above.
Male
Female
Total
Occupational
17
18
35
Domestic
10
38
48
Leisure
45
16
Elsewhere
11
14
25
Total
86
169
Researchers want to conduct a hypothesis test using the hypotheses:
Ho: There is no relationship between the variables Sex and Location.
Ha: There is a relationship between the variables Sex and Location.
Round all calculated answers to 4 decimal places where appropriate.
1. Which statistical test should they use?
OA. x2 test of independence
B. t-test for the slope of the regression line
C. Z-test for one population proportion
D. t-test for a sample mean
OE. x' goodness of fit test
2. What is the degrees of freedom for this test?
df =
3. Under the null hypothesis model, what is the expected count for Female in the Domestic location?
Expected count =
83
Expert Solution
This question has been solved!
Explore an expertly crafted, step-by-step solution for a thorough understanding of key concepts.

Step by stepSolved in 6 steps

Knowledge Booster


Learn more about
Need a deep-dive on the concept behind this application? Look no further. Learn more about this topic, statistics and related others by exploring similar questions and additional content below.Similar questions
- On a map, a distance of 2 cm represents 15 km. What is the distance (in km) between two cities that are 9 cm apart on the map? (See Example 2 in this section.) kmarrow_forwardYour cousin says she only needs thelength of one side of a square to find the area. Is your cousin correct? Explain.arrow_forwardFind the length of the unknown sidearrow_forward
- The Brown Company has 12 male workers with an average height of 170 cm. Saint and Brown are new workers so that when combined the average height of male workers becomes 172.2 cm. If Saint's height is 166 cm. How tall is Shwan?arrow_forwardWhat is the type of triangle for 10, 10, 10 √2arrow_forwardDarnell has a circular design that he wants to color red. He knows that the design is 12 inches in diameter. True or false, he knows he will color at least 108 square inches in red.arrow_forward
- Home plate on a baseball diamond has 3 right angles. What is the sum of the messure of ∠x and ∠y?arrow_forward3. What is the quotient to the following? A sandbox has an area of 26 square feet, and the length is 5 feet. What is the width of 2 the sandbox?arrow_forwardfind dly? dxdz -2 Czサ-31hax) 29ニ = canstab tarrow_forward
arrow_back_ios
SEE MORE QUESTIONS
arrow_forward_ios
Recommended textbooks for you
- MATLAB: An Introduction with ApplicationsStatisticsISBN:9781119256830Author:Amos GilatPublisher:John Wiley & Sons Inc
 Probability and Statistics for Engineering and th...StatisticsISBN:9781305251809Author:Jay L. DevorePublisher:Cengage Learning
 Statistics for The Behavioral Sciences (MindTap C...StatisticsISBN:9781305504912Author:Frederick J Gravetter, Larry B. WallnauPublisher:Cengage Learning
  Elementary Statistics: Picturing the World (7th E...StatisticsISBN:9780134683416Author:Ron Larson, Betsy FarberPublisher:PEARSON
 The Basic Practice of StatisticsStatisticsISBN:9781319042578Author:David S. Moore, William I. Notz, Michael A. FlignerPublisher:W. H. Freeman
 Introduction to the Practice of StatisticsStatisticsISBN:9781319013387Author:David S. Moore, George P. McCabe, Bruce A. CraigPublisher:W. H. Freeman
MATLAB: An Introduction with Applications
Statistics
ISBN:9781119256830
Author:Amos Gilat
Publisher:John Wiley & Sons Inc
Probability and Statistics for Engineering and th...
Statistics
ISBN:9781305251809
Author:Jay L. Devore
Publisher:Cengage Learning
Statistics for The Behavioral Sciences (MindTap C...
Statistics
ISBN:9781305504912
Author:Frederick J Gravetter, Larry B. Wallnau
Publisher:Cengage Learning
Elementary Statistics: Picturing the World (7th E...
Statistics
ISBN:9780134683416
Author:Ron Larson, Betsy Farber
Publisher:PEARSON
The Basic Practice of Statistics
Statistics
ISBN:9781319042578
Author:David S. Moore, William I. Notz, Michael A. Fligner
Publisher:W. H. Freeman
Introduction to the Practice of Statistics
Statistics
ISBN:9781319013387
Author:David S. Moore, George P. McCabe, Bruce A. Craig
Publisher:W. H. Freeman