
ENGR.ECONOMIC ANALYSIS
14th Edition
ISBN: 9780190931919
Author: NEWNAN
Publisher: Oxford University Press
expand_more
expand_more
format_list_bulleted
Related questions
Question

Transcribed Image Text:Page |6
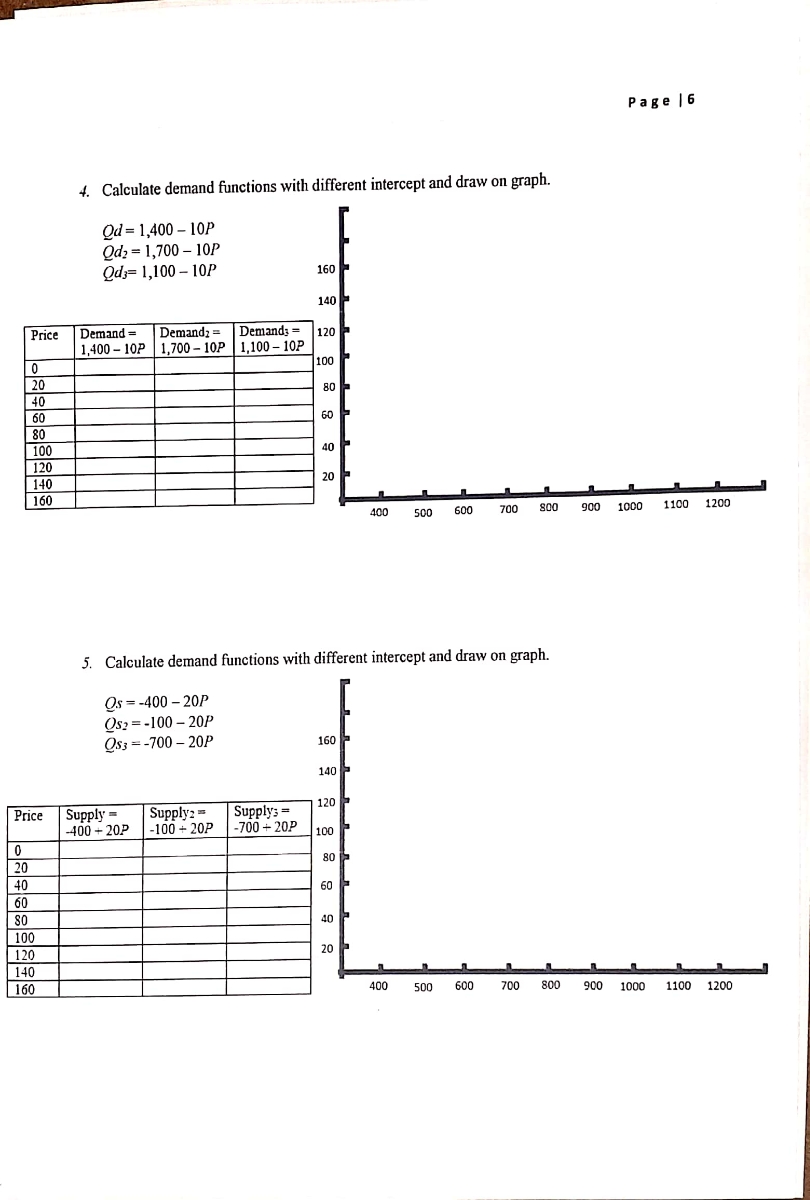
4. Calculate demand functions with different intercept and draw on graph.
Qd = 1,400 – 10P
Odz = 1,700 – 10P
Qdz= 1,100 – 10P
160
140
Demand =
1,400 – 10P 1.700 – 10P | 1.100 – 10P
Price
Demandz = Demand; =
120
100
20
40
80
60
60
80
100
40
120
20 F
140
160
1000
1100
1200
400
500
600
700
900
5. Calculate demand functions with different intercept and draw on graph.
Qs = -400 – 20P
Os2 =-100 – 20P
Qs3 =-700 – 20P
160
140
120
Supply =
-400 + 20P
Supply2 =
-100 + 20P
Supply; =
-700 + 20P
Price
100
80
20
40
60
60
So
40
100
| 120
| 140
| 160
20 P
400
500
600
700
800
900 1000
1100 1200
Expert Solution
This question has been solved!
Explore an expertly crafted, step-by-step solution for a thorough understanding of key concepts.

This is a popular solution

Trending nowThis is a popular solution!

Step by stepSolved in 2 steps with 1 images

Knowledge Booster


Learn more about
Need a deep-dive on the concept behind this application? Look no further. Learn more about this topic, economics and related others by exploring similar questions and additional content below.Similar questions
- 8) Price (€ per liter) 15 10 5 A) 0 B) 400 C) 1,000 D) 1,600 Don 1000 2000 3000 4000 5000 6000 Quantity (liters) Refer to the figure above. The total demand curve has the vertical intercept at and the horizontal intercept at Dom , and its slope A) 15.00 euros; 7,000 liters; changes at 10.00 euros B) 15.00 euros; 7,000 liters; changes at 8.12 euros C) 18.00 euros; 7,000 liters; is twice as steep as Sue's demand curve D) 10.00 euros; 7,000 liters; is half as steep as Carlos's demand curve 9) Refer to the figure above. If the price of gasoline is 12.00 euros per liter, the total quantity of gasoline demanded is liters.arrow_forward6. A fast-food restaurant determines that each 10¢ inc «ase in the price of a hamburger results in 25 fewer hamburgers sold. The usual price for a hamburger is $5.00 and the restaurant sells 300 hamburgers each day. a) Write an equation to model the daily revenue for the restaurant. b) Find the optimal price for a hamburger. c) What is the optimal revenue?arrow_forwardHans is a butcher in Washington. The following contains data on prices and weekly sales at his shop Good Beef Chicken Price 9.00/lbs $4.00/lbs Quantity 400 lbs 300 lbs ShS He estimates that the own price elasticity for beef is 2 and for chicken is .75. He also estimates that the cross price elasticity for chicken is .60. His current revenue from the sale of these two goods is making a total of $4800/week. In the spirit of the return to good times and outdoor grilling, he has decided to lower the price of beef for the summer, from $9.00 to $8.55. Overall, Hans can expect to take in dollars in revenue, given the information in this problem? (Revenue = Price x sales). Record your answer without a dollar sign and without a comma. Helpful Hint: In this problem, we are not changing the price of chicken.arrow_forward
- Graph and solve attachments:arrow_forwardIf the price elasticity of demand is equal to infinity and the price were to rise, the quantity demanded would: O increase. O not change. O fall to zero. O decrease slightly. 21 ottv MacBook Pro F8 F9 F6 F7 000 F4 F5 F3 *arrow_forwardHow do I calculate the price elasticity in this chart? and how do I graph the results? P Q Price Total Elasticity Revenue $9.00 1 - 9 $8.00 2 16 $7.00 3 21 $6.00 4 24 $5.00 5 25 $4.00 6 24 $3.00 7 21 $2.00 8 16arrow_forward
- 45 2 39 35 33 30 42+ 39 + 36- 27 24 229 21 18 Frice 15 12 9 6 3 Demand 200 400 600 800 1000 1200 1400 Quantity Refer to Figure 5-12. If the price increases from $12 to $24, total revenue would increase by $4,800, and demand is elastic increase by $2440, and demand is inelastic O decrease by $4,800, and demand is inclastic between points X and Z. decrease by $7,200, and demand is inclastic between points X and Z. 4arrow_forwardonly typed solutionarrow_forwardInvestigate how demand elasticities are affected by increases in demand. Apply the midpoint formula to calculate the demand elasticities. 2 0 (c) 10 0 20 30 Quantity 10 40 Given the shift in demand, the elasticity between points a' and b'in Figure a = b. The elasticity of demand for D2 between points c and dis 0.56. Given the shift in demand, the elasticity between points c'and d'in Figure b = 20 Quantity 30 D₁ 50 60 40 Instructions: In parts a, b, and c, round your answers to two decimal places. Enter your answers as a positive value (absolute value). a. The elasticity of demand for D₁ between points a and bis 1.80. D₂ (45, 4.5) 50 0 c. The elasticity I demand for D3 between points e and fis 1.00. Given the shift in demand, the elasticity between points e' and f'in Figure c = 0 0 10 20 D₂ 30 Quantity (b) 40 50arrow_forward
- am. 122.arrow_forwardAccording to the income elasticity formula below, Income elasticity of demand - E= change in quontity demanded + % change in income By how much will popcorn sales increase if everage income goes up by 17 percent? (Assume the income elasticity of popcom is 329) Instructions: Enter your response as a percentage rounded to one decimal place. percent MicBonk Pro 2 3. E R Y H K D B M command commandarrow_forwardRefer to the graph shown. Demand is unit elastic when revenue is: Revenue in thousands of dollars 99876SMO 10 A B 246 Multiple Choice $8,000 $10,000. D E 10 8 Quantity F G 12 14 16 Refer to the graph shown. Demand is unit elastic when revenue is: Revenue in 2 4 6 Multiple Choice $8,000 $10,000 D 8 10 Quantity G S 12 14 16 Ćarrow_forward
arrow_back_ios
SEE MORE QUESTIONS
arrow_forward_ios
Recommended textbooks for you
 Principles of Economics (12th Edition)EconomicsISBN:9780134078779Author:Karl E. Case, Ray C. Fair, Sharon E. OsterPublisher:PEARSON
 Engineering Economy (17th Edition)EconomicsISBN:9780134870069Author:William G. Sullivan, Elin M. Wicks, C. Patrick KoellingPublisher:PEARSON
 Principles of Economics (MindTap Course List)EconomicsISBN:9781305585126Author:N. Gregory MankiwPublisher:Cengage Learning
 Managerial Economics: A Problem Solving ApproachEconomicsISBN:9781337106665Author:Luke M. Froeb, Brian T. McCann, Michael R. Ward, Mike ShorPublisher:Cengage Learning
 Managerial Economics & Business Strategy (Mcgraw-...EconomicsISBN:9781259290619Author:Michael Baye, Jeff PrincePublisher:McGraw-Hill Education
Principles of Economics (12th Edition)
Economics
ISBN:9780134078779
Author:Karl E. Case, Ray C. Fair, Sharon E. Oster
Publisher:PEARSON
Engineering Economy (17th Edition)
Economics
ISBN:9780134870069
Author:William G. Sullivan, Elin M. Wicks, C. Patrick Koelling
Publisher:PEARSON
Principles of Economics (MindTap Course List)
Economics
ISBN:9781305585126
Author:N. Gregory Mankiw
Publisher:Cengage Learning
Managerial Economics: A Problem Solving Approach
Economics
ISBN:9781337106665
Author:Luke M. Froeb, Brian T. McCann, Michael R. Ward, Mike Shor
Publisher:Cengage Learning
Managerial Economics & Business Strategy (Mcgraw-...
Economics
ISBN:9781259290619
Author:Michael Baye, Jeff Prince
Publisher:McGraw-Hill Education