College Physics
11th Edition
ISBN: 9781305952300
Author: Raymond A. Serway, Chris Vuille
Publisher: Cengage Learning
expand_more
expand_more
format_list_bulleted
Concept explainers
Question
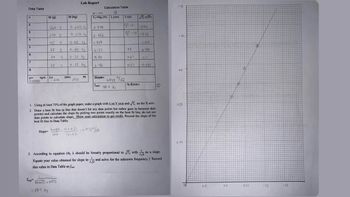
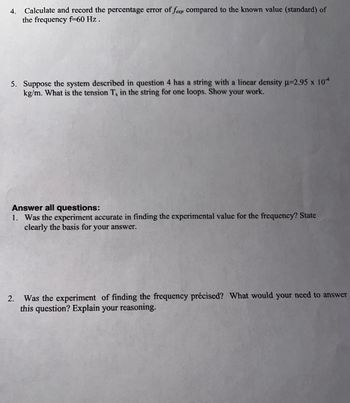
Hello, based on the picture with two pages on it can you help me do the last page (the one alone in the picture) please. It will be a great help for me

Transcribed Image Text:Data Table
n
2
3
4
5
6
7
8
U=
0.00031
M (g)
kg/m L=
fexp
260 2
240 g
105 5
65
9
50 g
35 9
2m
M (kg)
= 58.4 H₂
V-00031 x 0-473
0.260 kg
0.240 kg
Lab Report
0.105 kg
0.65 kg
0.50 ks
0.35 kg
cm==
200
m
M 9.81
(
T-Mg (N) 2 (cm)
2-548
2-352
1.029
6.37
4.90
3.43
Calculation Table
Slope=
Slope height 16x 0.276-973/
-
base
176.31
0.973/
texpo 58.4 H₂
λ (m)
2x2=2
1.596
22-133 1.533
I
0-8
0.67
√T, (√N)
0-57
1. Using at least 75% of the graph paper, make a graph with 2 on Y axis and √T, on the X axis.
2. Draw a best fit line (a line that doesn't hit any data points but rather goes in between data
points) and calculate the slope by picking two points exactly on the best fit line, do not use
data points to calculate slope, Show your calculation to get credit. Record the slope of the
best fit line in Data Table.
% Error=
1.014
0-798
0.7
0.585
3. According to equation (4), à should be linearly proportional to √T, with as a slope.
Equate your value obtained for slope to and solve for the unknown frequency f. Record
this value in Data Table as fep
2
1.33
1.06
0-8
0.53
0.27
D/
0-31
9.61
0.92
G
1-23
1.53

Transcribed Image Text:4. Calculate and record the percentage error of fexp compared to the known value (standard) of
the frequency f=60 Hz.
5. Suppose the system described in question 4 has a string with a linear density µ-2.95 x 10⁴
kg/m. What is the tension T, in the string for one loops. Show your work.
Answer all questions:
1. Was the experiment accurate in finding the experimental value for the frequency? State
clearly the basis for your answer.
2.
Was the experiment of finding the frequency précised? What would your need to answer
this question? Explain your reasoning.
Expert Solution
This question has been solved!
Explore an expertly crafted, step-by-step solution for a thorough understanding of key concepts.
Step by stepSolved in 4 steps with 3 images

Knowledge Booster
Learn more about
Need a deep-dive on the concept behind this application? Look no further. Learn more about this topic, physics and related others by exploring similar questions and additional content below.Similar questions
- 7)arrow_forwardIf you have a mirror that curved in the opposite direction, then the one that is in #4 (in the image attached) Will the focal length be the same for this mirror as it is in #4? It will still be negative It will now be positive It is hard to know at this time It will not have a focal length Describe what this mirror looks like in the space below Now draw that mirror Go back up to part n and do the following steps: Draw the ray that will only head to the vertex. MAKE SURE TO LABLE THIS RAY AS #1 Now depending on where you put the vertical arrow, draw the ray that goes thru the focal point Can you see where this image will form? Yes No Circle all that apply… From the notes and the lecture, the image formed will be: On the same side as the object On the opposite side of the mirror It will depend on the object’s location Is this image located: Behind the focal point In front of the focal point At the center of curvature Behind the center of curvature Between the…arrow_forwardA 4.0-cm-tall object is 15 cm in front of a convex mirror that has a -25 cm focal length. Earrow_forward
- - Part A Consider a typical convex passenger-side mirror with a focal length of -80 cm. A 1.7-m-tall cyclist on a bicycle is 25 m from the mirror. You are 1.4 m from the mirror, and suppose, for simplicity, that the mirror, you, and the cyclist all lie along a line. How far are you from the image of the cyclist? Express your answer with the appropriate units. μΑ L = Value Units Submit Request Answer Part B What is the image height? Express your answer with the appropriate units. HA h' = Value Units %3Darrow_forwardI need help with problems A,B,C,D and E. I am really struggling with this problem I asked my professor and he won't help me. I was wondering if you can help me solve these problems. Also, Can you label which problem is A,B,C,D and E. Thank youarrow_forwardThe two mirrors in the figure below meet at a right angle. The beam of light in the vertical plane P strikes mirror 1 at 0₁ as shown. = 47.8° Light beam Mirror 2 1.25 m Mirror 1 P (a) Determine the distance the reflected light beam travels before striking mirror 2. m (b) In what direction does the light beam travel after being reflected from mirror 2? above the horizontal Need Help? Read It Watch Itarrow_forward
- A concave mirror has a focal length of 20 cm. Knowing that the image was placed 12 cm from the mirror: 10 a) What is the position (in cm) of resulting image? b) Draw a ray diagram to locate the image c) Describe the formed image.arrow_forwardAn astronomer orients two plane mirrors at an angle of 0, = 57.5° to each other, as shown below. He then directs a horizontal laser beam toward Mirror 1. The beam reflects twice: first off Mirror 1, then Mirror 2. What angle 0, will the outgoing beam make with the surface of Mirror 2? (Enter your answer in in degrees.) Mirror 1 Mirror 2arrow_forward
arrow_back_ios
arrow_forward_ios
Recommended textbooks for you
 College PhysicsPhysicsISBN:9781305952300Author:Raymond A. Serway, Chris VuillePublisher:Cengage Learning
 University Physics (14th Edition)PhysicsISBN:9780133969290Author:Hugh D. Young, Roger A. FreedmanPublisher:PEARSON
 Introduction To Quantum MechanicsPhysicsISBN:9781107189638Author:Griffiths, David J., Schroeter, Darrell F.Publisher:Cambridge University Press
 Physics for Scientists and EngineersPhysicsISBN:9781337553278Author:Raymond A. Serway, John W. JewettPublisher:Cengage Learning
 Lecture- Tutorials for Introductory AstronomyPhysicsISBN:9780321820464Author:Edward E. Prather, Tim P. Slater, Jeff P. Adams, Gina BrissendenPublisher:Addison-Wesley
 College Physics: A Strategic Approach (4th Editio...PhysicsISBN:9780134609034Author:Randall D. Knight (Professor Emeritus), Brian Jones, Stuart FieldPublisher:PEARSON

College Physics
Physics
ISBN:9781305952300
Author:Raymond A. Serway, Chris Vuille
Publisher:Cengage Learning

University Physics (14th Edition)
Physics
ISBN:9780133969290
Author:Hugh D. Young, Roger A. Freedman
Publisher:PEARSON

Introduction To Quantum Mechanics
Physics
ISBN:9781107189638
Author:Griffiths, David J., Schroeter, Darrell F.
Publisher:Cambridge University Press

Physics for Scientists and Engineers
Physics
ISBN:9781337553278
Author:Raymond A. Serway, John W. Jewett
Publisher:Cengage Learning

Lecture- Tutorials for Introductory Astronomy
Physics
ISBN:9780321820464
Author:Edward E. Prather, Tim P. Slater, Jeff P. Adams, Gina Brissenden
Publisher:Addison-Wesley

College Physics: A Strategic Approach (4th Editio...
Physics
ISBN:9780134609034
Author:Randall D. Knight (Professor Emeritus), Brian Jones, Stuart Field
Publisher:PEARSON