
Algebra and Trigonometry (6th Edition)
6th Edition
ISBN: 9780134463216
Author: Robert F. Blitzer
Publisher: PEARSON
expand_more
expand_more
format_list_bulleted
Related questions
Concept explainers
Question

Transcribed Image Text:Concise Core Mathemalil
() their total income for 2006, if there was a
decrease of 8% mcome on advertising, an
increase of 5% on donations, but the rest
remained unchanged
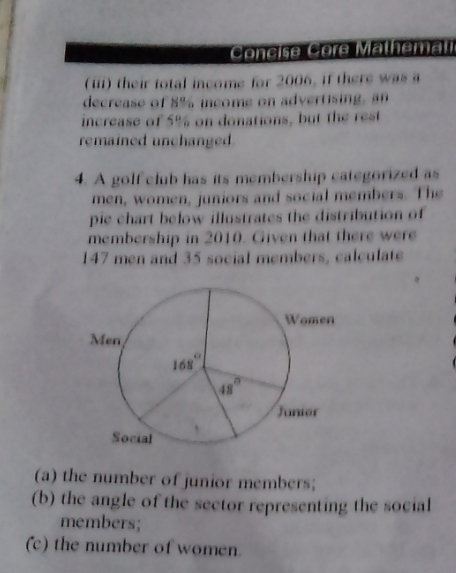
4. A golf club has its membership categorized as
men, women, juniors and social members The
pie chart below illustrates the distribution of
membership in 2010. Given that there were
147 men and 35 social memberss, calculate
Women
Men/
168
48
Junior
Social
(a) the number of junior members;
(b) the angle of the sector representing the social
members;
(c) the number of women.
Expert Solution
This question has been solved!
Explore an expertly crafted, step-by-step solution for a thorough understanding of key concepts.

This is a popular solution

Trending nowThis is a popular solution!

Step by stepSolved in 3 steps with 2 images

Knowledge Booster


Learn more about
Need a deep-dive on the concept behind this application? Look no further. Learn more about this topic, algebra and related others by exploring similar questions and additional content below.Similar questions
- Heal the Bay is an environmental organization that releases an annual beach report card based on water quality. The 2019 ratings for 14 beaches (1 is the best and 7 is the worst). A. Construct a dotpplot according to the following rate: 1,3,3,1,2,7,4,2,2,2,2,2,3,4. What rate is higher according to the dotplot?_____. (Please make the table including class limit, boundary, frequency) B. Construct a histogram by using a single number. What is the shape of histogram?(Symmetric, Positive skewed, or negative)______. Is there any gap? If yes where?_________.arrow_forward5. Mr. Mike Hunt wants to make an investment in the stock market. He has shortlisted stocks and wants to know the frequency of the prices. So, he created the following table where the number of stocks falling in the particular price categories. a. Represent the data set in a suitable graph with appropriate information (like title, axis, label etc.) and comments on the graph.b. How many stocks Mr. Rahman shortlisted that cost below 1900?c. Which class has the maximum and minimum no. of shares?d. Which class has the second maximum and second minimum no. of shares?arrow_forwardStudents at a high school were polled to determine the type of music they preferred. There were 1960 students who completed the poll. Their responses are represented in the circle graph. Music Preferences O Rap 906 O Alternative 478 What percent of students preferred country music? Rock and Roll 280 Country 166 Jazz 35 Other 95 ..... About % of the students who completed the poll preferred country music. (Round to one decimal place as needed.)arrow_forward
- 4. The five-number-summary of a box plot are the five numbers that separate the sections of the boxplot (minimum, Q, median, Q., and maximum). List these 5 numbers if a boxplot is created from the following numbers. -7 1 -1 1 -7 22 7 -5 1arrow_forwardBelow are the ages of the starters on two soccer teams.FC Looneys: 26, 31, 29, 30, 30, 26, 26, 31, 31, 31, 21Poppers FC: 25, 19, 22, 24, 26, 30, 25, 21, 23, 28, 26 describe theshape(skewed/symmetric, modality, outliers) for each. Determine the appropriate measures of center and spread for each data set, according to the shapes.Then Calculate them.(Make sure to only select one measure of center and one measure of spread) Write a comparison, in context, between the two distributions. Make sure to use the appropriatemeasures of center and spread when comparing. Mention outliers, if anyarrow_forwardUse the same scales to construct modified boxplots for the pulse rates of males and females from the accompanying data sets. Identify any outliers. Use the boxplots to compare the two data sets. Click the icon to view the data sets. Determine the boxplot for the men's pulse rate data. Choose the correct graph below. O A. O C. xx HE 40 50 60 70 80 90 100110 O C. What points are outliers? OA. 46 O B. 46, 89, 105 OC. 46, 48, 105 O D. 105 40 50 60 70 80 90 100110 -ידי xH Determine the boxplot for the women's boxplot data. Choose the correct graph below. O A. Q 40 50 60 70 80 90 100110 xH Q 40 50 60 70 80 90 100110 Q ✔ Q ✔ C O B. O D. O B. O D. 841x 40 50 60 70 80 90 100110 X 40 50 60 70 80 90 100110 40 50 60 70 80 90 100110 XX 40 50 60 70 80 90 100110 Q Q M Q Q ✔ Pulse rates for men and women Men's Pulse Rates 59 72 72 58 84 50 58 65 66 55 105 64 65 77 70 62 Women's Pulse Rates 76 70 74 83 59 67 65 72 74 89 85 78 56 80 60 46 70 59 70 75 66 68 66 72 77 78 97 74 62 81 54 74 77 79 89 95 59 98…arrow_forward
- Graph the set of data using the appropriate type of graph (bar graph, line graph, scatter graph, or pie chart) TABLE 5 Favorite Vegetables Boys Girls Broccoli 2 5 Carrots 6 7 Corn 10 8 Peas 8 5 Squash 5 6arrow_forwardB) has more than one answer .. Thank youarrow_forward5. Find the five-number summary and the interquartile range for the given set of numbers, and then draw the box plot: 10, 11, 13, 14, 16, 17, 19, 20, 21, 23, 24 W MacBook Air F6 F7 FB F9 F10 FITarrow_forward
- A)Find the mean, median, mode, and range for the following data set 59,65,70,71,71,74,75,78,80,83,84,87,91,98,100 B)find the five number summary and draw a box plot. Briefly describe the shape and variation of the distribution. Explain your results.arrow_forwardCheck the following data set for outliers. If there is more than one answer, separate them with commas. Select "None" if applicable. , 33, 24, 39, 36, 59, 40 Outliersarrow_forwardUse the data to identify any outliers.arrow_forward
arrow_back_ios
SEE MORE QUESTIONS
arrow_forward_ios
Recommended textbooks for you
- Algebra and Trigonometry (6th Edition)AlgebraISBN:9780134463216Author:Robert F. BlitzerPublisher:PEARSON
 Contemporary Abstract AlgebraAlgebraISBN:9781305657960Author:Joseph GallianPublisher:Cengage Learning
 Linear Algebra: A Modern IntroductionAlgebraISBN:9781285463247Author:David PoolePublisher:Cengage Learning
  Algebra And Trigonometry (11th Edition)AlgebraISBN:9780135163078Author:Michael SullivanPublisher:PEARSON
 Introduction to Linear Algebra, Fifth EditionAlgebraISBN:9780980232776Author:Gilbert StrangPublisher:Wellesley-Cambridge Press
 College Algebra (Collegiate Math)AlgebraISBN:9780077836344Author:Julie Miller, Donna GerkenPublisher:McGraw-Hill Education
Algebra and Trigonometry (6th Edition)
Algebra
ISBN:9780134463216
Author:Robert F. Blitzer
Publisher:PEARSON
Contemporary Abstract Algebra
Algebra
ISBN:9781305657960
Author:Joseph Gallian
Publisher:Cengage Learning
Linear Algebra: A Modern Introduction
Algebra
ISBN:9781285463247
Author:David Poole
Publisher:Cengage Learning
Algebra And Trigonometry (11th Edition)
Algebra
ISBN:9780135163078
Author:Michael Sullivan
Publisher:PEARSON
Introduction to Linear Algebra, Fifth Edition
Algebra
ISBN:9780980232776
Author:Gilbert Strang
Publisher:Wellesley-Cambridge Press
College Algebra (Collegiate Math)
Algebra
ISBN:9780077836344
Author:Julie Miller, Donna Gerken
Publisher:McGraw-Hill Education