
MATLAB: An Introduction with Applications
6th Edition
ISBN: 9781119256830
Author: Amos Gilat
Publisher: John Wiley & Sons Inc
expand_more
expand_more
format_list_bulleted
Related questions
Question
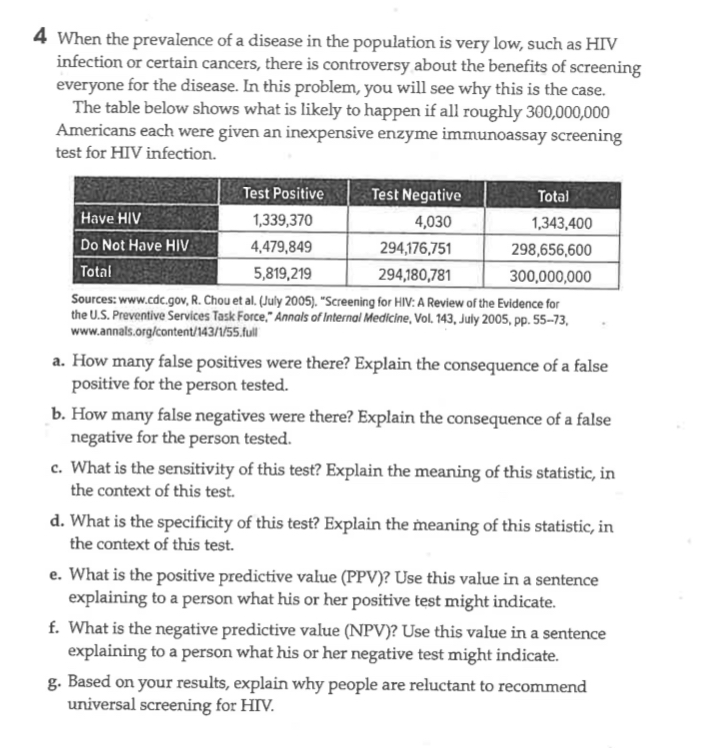

Transcribed Image Text:**Table Explanation:**
The table represents the outcomes of an enzyme immunoassay screening test for HIV applied to a hypothetical population of 300 million Americans.
**Table Data:**
- **Have HIV:**
- Test Positive: 1,339,370
- Test Negative: 4,030
- Total: 1,343,400
- **Do Not Have HIV:**
- Test Positive: 4,479,849
- Test Negative: 294,176,751
- Total: 298,656,600
- **Overall Totals:**
- Test Positive: 5,819,219
- Test Negative: 294,180,781
- Total: 300,000,000
**Questions and Analysis:**
a. **False Positives:**
- There are 4,479,849 false positives (people who do not have HIV but tested positive). False positives can lead to anxiety, unnecessary further testing, and psychological distress for the person tested.
b. **False Negatives:**
- There are 4,030 false negatives (people who have HIV but tested negative). False negatives can result in a lack of necessary treatment and care, potentially leading to the spread of the virus.
c. **Sensitivity:**
- Sensitivity is calculated as the proportion of true positives (1,339,370) out of the total who have HIV (1,343,400). It measures the test's ability to correctly identify those with the disease.
d. **Specificity:**
- Specificity is the proportion of true negatives (294,176,751) out of all those who do not have HIV (298,656,600). It measures the test's ability to correctly identify those without the disease.
e. **Positive Predictive Value (PPV):**
- PPV is the probability that a person truly has HIV given that they tested positive. Use the formula: PPV = True Positives / Total Test Positives.
f. **Negative Predictive Value (NPV):**
- NPV is the probability that a person truly does not have HIV given that they tested negative. Use the formula: NPV = True Negatives / Total Test Negatives.
g. **Reluctance for Universal Screening:**
- Reluctance to recommend universal screening may be due to the high number of false positives,
Expert Solution
This question has been solved!
Explore an expertly crafted, step-by-step solution for a thorough understanding of key concepts.

This is a popular solution

Trending nowThis is a popular solution!

Step by stepSolved in 4 steps

Knowledge Booster

Similar questions
- You have a small sample of voting information for a recent election. This includes data on which party a person voted for (dem-1 for democrat, =0 for other), gender (male=1 for male, =0 for female), income (in thousands of dollars) and age (in years). You create a table tabulating votes by gender. 1 dem I 01 11 0.045 O.348 545 0.602 -+- O.500 male 0 10 12 Total I 22 In a linear probability model of dem on male, what is the intercept coefficient? (Hint: calculate the relevant probabilities.) 11 Total 81 18 61 18 ------- + 141 36arrow_forwardThe table shows the leading causes of death in a certain country in a recent year. The population of the country was 311311 million. If you lived in a typical city of 500,000, how many people would you expect to die of cancercancer each year? Cause Deaths Cause Deaths Heart disease 596 comma 700596,700 Alzheimer's disease 84 comma 90084,900 Cancer 575 comma 300575,300 Diabetes 73 comma 40073,400 Chronic respiratory diseases 143 comma 100143,100 Pneumonia/Influenza 53 comma 40053,400 Stroke 128 comma 600128,600 Kidney disease 45 comma 30045,300 Accidents 122 comma 500122,500 Suicide 38 comma 60038,600 About people would be expected to die of cancer each year. (Type a whole number. Round to the nearest person as needed.)arrow_forwardThe table below reveals the relative frequencies of students and how they get to and from school. Why is the lower right cell in this table 100%? is it because every row in this sort of table adds to 100? all of the other numbers in the table add to 100? it was just a lucky set of numbers that happened to add to 100? or because 100% represents all of the students who were included in the data set?arrow_forward
- The rabies vaccine for dogs can save your dog's life. If your dog bites another animal or is on the receiving end of a bite, the vaccine can protect them from a dangerous and potentially fatal illness. Furthermore, in most places, the rabies vaccine for dogs is legally required. The NYC Department of Health wants to know if LESS than 95% of the dogs in the city have been vaccinated with their rabies vaccine. 158,045 of the 165,000 dogs examined had their rabies shots. Risk no more than 5% Type I error. What kind of test will you need to perform? A A right, one-tailed z-test B A left, one-tailed z-test C A two-tailed z- testarrow_forwardPractice question #3 Investigators want to know if those who work long hours have more trouble sleeping. In one sample of 190 British civil servants who worked more than 40 hours a week, 95 of them said they usually get less than 7 hours of sleep per night. In a second sample of 150 British civil servants who worked between 35 and 40 hours per week, 63 of them said they usually get less than 7 hours of sleep per night. The investigators believe these are represent samples of the populations. Find a 95% Confidence Interval for the difference in proportions of these two populations that get less than 7 hours of sleep per night. Then interpret the confidence interval. Be sure to check that any necessary conditions are met first. Round final answers to 3 decimal places. Verify conditions are appropriate for method: Interval: ________________________ Does the interval contain zero? __________ What does this information lead you to conclude?arrow_forwardThe following table shows some data from a study on substance use among 10th graders in the United States and Europe. Smoked Cigarettes Cigarette-Free Totals U.S. 14,000 Europe 96,000 Total 71,210 110,000arrow_forward
- Hello, can you help with with this problem?arrow_forwardIn 1993 approximately 62.1 million Americans suffered injuries, as reported by the National Center for Health Statistics in Vital and Health Statistics. More males (33.4 million) were injured than females (28.7 million). Those statistics do not tell us whether males and females tend to be injured in similar circumstances. One set of categories commonly used for accident circumstances. One set of categories commonly used for accident circumstance is "while at work," "home", "motor vehicle", and "other". A random sample of accident reports gave the data in contingency table below. Male Female While at work 19 24 27 Home 14 Motor Vehicle 26 Other At the 5% significance level, do the data provide sufficient evidence to conclude that an association exists between accident circumstances and sex? Type in Canvas the grand total. 35arrow_forward
arrow_back_ios
arrow_forward_ios
Recommended textbooks for you
- MATLAB: An Introduction with ApplicationsStatisticsISBN:9781119256830Author:Amos GilatPublisher:John Wiley & Sons Inc
 Probability and Statistics for Engineering and th...StatisticsISBN:9781305251809Author:Jay L. DevorePublisher:Cengage Learning
 Statistics for The Behavioral Sciences (MindTap C...StatisticsISBN:9781305504912Author:Frederick J Gravetter, Larry B. WallnauPublisher:Cengage Learning
  Elementary Statistics: Picturing the World (7th E...StatisticsISBN:9780134683416Author:Ron Larson, Betsy FarberPublisher:PEARSON
 The Basic Practice of StatisticsStatisticsISBN:9781319042578Author:David S. Moore, William I. Notz, Michael A. FlignerPublisher:W. H. Freeman
 Introduction to the Practice of StatisticsStatisticsISBN:9781319013387Author:David S. Moore, George P. McCabe, Bruce A. CraigPublisher:W. H. Freeman
MATLAB: An Introduction with Applications
Statistics
ISBN:9781119256830
Author:Amos Gilat
Publisher:John Wiley & Sons Inc
Probability and Statistics for Engineering and th...
Statistics
ISBN:9781305251809
Author:Jay L. Devore
Publisher:Cengage Learning
Statistics for The Behavioral Sciences (MindTap C...
Statistics
ISBN:9781305504912
Author:Frederick J Gravetter, Larry B. Wallnau
Publisher:Cengage Learning
Elementary Statistics: Picturing the World (7th E...
Statistics
ISBN:9780134683416
Author:Ron Larson, Betsy Farber
Publisher:PEARSON
The Basic Practice of Statistics
Statistics
ISBN:9781319042578
Author:David S. Moore, William I. Notz, Michael A. Fligner
Publisher:W. H. Freeman
Introduction to the Practice of Statistics
Statistics
ISBN:9781319013387
Author:David S. Moore, George P. McCabe, Bruce A. Craig
Publisher:W. H. Freeman