ENGR.ECONOMIC ANALYSIS
14th Edition
ISBN: 9780190931919
Author: NEWNAN
Publisher: Oxford University Press
expand_more
expand_more
format_list_bulleted
Question
thumb_up100%

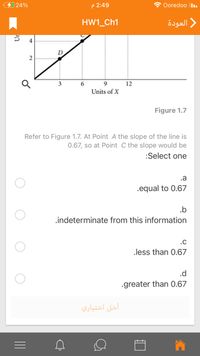
Transcribed Image Text:424%
P 2:49
Ooredoo I.
HW1_Ch1
العودة
4
D
3
9
12
Units of X
Figure 1.7
Refer to Figure 1.7. At Point A the slope of the line is
0.67, so at Point C the slope would be
:Select one
.a
.equal to 0.67
.b
.indeterminate from this information
.C
.less than 0.67
.d
.greater than 0.67
أخل اختياري
II

Transcribed Image Text:22%
P 2:46
Ooredoo I.
HW1_Ch1
العودة
Not yet answered
سؤال 4
Marked out of 1.00
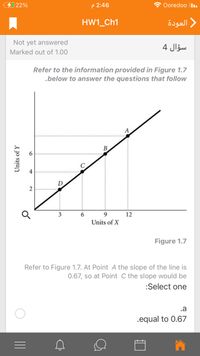
Refer to the information provided in Figure 1.7
.below to answer the questions that follow
A
B.
4
D
2
3
6.
9
12
Units of X
Figure 1.7
Refer to Figure 1.7. At Point A the slope of the line is
0.67, so at Point C the slope would be
:Select one
.a
.equal to 0.67
Units of Y
Expert Solution
This question has been solved!
Explore an expertly crafted, step-by-step solution for a thorough understanding of key concepts.
This is a popular solution
Trending nowThis is a popular solution!
Step by stepSolved in 2 steps

Knowledge Booster
Learn more about
Need a deep-dive on the concept behind this application? Look no further. Learn more about this topic, economics and related others by exploring similar questions and additional content below.Similar questions
- The blue curve on the following graph shows the height of an airplane over 10 minutes of flight. The two black lines are tangent to the curve at the points indicated by A and B. ALTITUDE (Thousands of feet) 40 35 25 20 ō 5 0 0 1 2 3 A 4 5 6 TIME (Minutes) 7 8 B 9 10arrow_forwardFind x for the following equation. In (x+4) + In 2 = 2 In x (Type an integer or a fraction. Use a comma to separate answers as needed.)arrow_forwardU t of estion English (en) Variable Y 24 20 16 12 8 4 O a. y = 8 - 2x. O b. x = 8 + 0.5y. O c. y = 8 + 2x. O d. (3) y = 8 + 0.5x. (1) + + 0 2 4 6 8 10 12 14 16 18 Variable X The linear equation for line (1) on the provided graph is (2)arrow_forward
- Find an equation in point-slope y -y, = m(x-x,) for the line through the given points. (- 3, – 3) and (2,7) What is the equation of the line in point-slope form? (Use integers or simplified fractions for any numbers in the equation.)arrow_forwardhelp please answer in text form with proper workings and explanation for each and every part and steps with concept and introduction no AI no copy paste remember answer must be in proper format with all workingarrow_forwardThis is how I interpret the question units of slope: distance/time?asaparrow_forward
- Variable Y 18 A A B 6 6 9 12 15 18 Variable X 15 12 6 3 O 3 لیا Refer to the provided graph. The slope of the line tangent to the curve at point B isarrow_forwardThe table lists weights (pounds) and highway mileage amounts (mpg) for seven automobiles. Use the sample data to construct a scatterplot. Use the first variable for the x-axis. Based on the scatterplot, what do you conclude about a linear correlation? Weight (lb) Highway (mpg) Which scatterplot below shows the data? O A. 40- 20+ 2000 5000 2855 3050 3810 3985 4250 2275 3525 33 32 27 24 22 39 28 Weight (lb) Q Q O B. 40 20+ 2000 AHH 5000 Weight (lb) Q Q Is there a linear relationship between weight and highway mileage? O A. No, there appears to be a relationship, but it is not linear. O B. Yes, as the weight increases the highway mileage decreases. O C. Yes, as the weight increases the highway mileage increases. OD. No there appears to be no relationshin C O C. Q 40- M Q 20++ 2000 5000 Weight (lb) Highway ( O D. Highway (mpg) 40- 20+ 2000 5000 Weight (lb) Qarrow_forwardy 0 A only A and D only A, B, and D E both C and E C D A B Refer to the diagram. Which line(s) show(s) a positive relationship between x and y? Xarrow_forward
- Stores commonly offer a cheaper unit price for large quantity purchases. Quantity Unit Price 100.00 80.00 70.00 50.00 40.00 Down 1 2 5 10 20 B P a. Make a graph of the data large enough to include a quantity of 30 (use graph paper, label completely, and choose the correct axis for the independent (x) and dependent (y) variables). b. Find the slope between quantities 1 and 2. Explain the meaning of the slope in context. The slope is which means Select an answer c. Find the slope between quantities 5 and 10. d. Add a trend line to the graph. e. Estimate the unit price for a quantity of 30 to the nearest dollar. S f. Estimate the quantity for a unit price of $44 to the nearest unit. unitsarrow_forwardWhat is the slope of the line to the equation P=30−1/2Q?arrow_forwardAccording to the following given information how to determine: 12 3 4 5 6 7 8 9 10 11 11 12 13 12 13 14 15 970 1,180 1,239 1,293 1,350 1,398 1,410 1,480 1,492 1,500 1,520 1,592 1,605 1,660 1,685 A) Break Even-point or points? B) How is to construct the relationship between entire variables through the simple drawing for all above figures and highlighting of Break Even point the drawing? C) Justify your final answer for each line of production. Production Times (months) product of (Z unit)arrow_forward
arrow_back_ios
arrow_forward_ios
Recommended textbooks for you

 Principles of Economics (12th Edition)EconomicsISBN:9780134078779Author:Karl E. Case, Ray C. Fair, Sharon E. OsterPublisher:PEARSON
 Engineering Economy (17th Edition)EconomicsISBN:9780134870069Author:William G. Sullivan, Elin M. Wicks, C. Patrick KoellingPublisher:PEARSON
 Principles of Economics (MindTap Course List)EconomicsISBN:9781305585126Author:N. Gregory MankiwPublisher:Cengage Learning
 Managerial Economics: A Problem Solving ApproachEconomicsISBN:9781337106665Author:Luke M. Froeb, Brian T. McCann, Michael R. Ward, Mike ShorPublisher:Cengage Learning
 Managerial Economics & Business Strategy (Mcgraw-...EconomicsISBN:9781259290619Author:Michael Baye, Jeff PrincePublisher:McGraw-Hill Education


Principles of Economics (12th Edition)
Economics
ISBN:9780134078779
Author:Karl E. Case, Ray C. Fair, Sharon E. Oster
Publisher:PEARSON

Engineering Economy (17th Edition)
Economics
ISBN:9780134870069
Author:William G. Sullivan, Elin M. Wicks, C. Patrick Koelling
Publisher:PEARSON

Principles of Economics (MindTap Course List)
Economics
ISBN:9781305585126
Author:N. Gregory Mankiw
Publisher:Cengage Learning

Managerial Economics: A Problem Solving Approach
Economics
ISBN:9781337106665
Author:Luke M. Froeb, Brian T. McCann, Michael R. Ward, Mike Shor
Publisher:Cengage Learning

Managerial Economics & Business Strategy (Mcgraw-...
Economics
ISBN:9781259290619
Author:Michael Baye, Jeff Prince
Publisher:McGraw-Hill Education