MATLAB: An Introduction with Applications
6th Edition
ISBN: 9781119256830
Author: Amos Gilat
Publisher: John Wiley & Sons Inc
expand_more
expand_more
format_list_bulleted
Concept explainers
Question

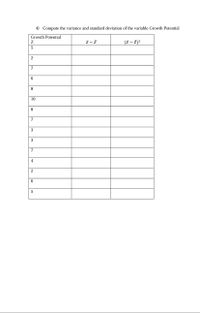
Transcribed Image Text:4) Compute the variance and standard deviation of the variable Growth Potential
Growth Potential
(Z – Z)²
7
6
8
10
8
7
3
3
7
4
2
6.
5
Ö N5
Expert Solution
This question has been solved!
Explore an expertly crafted, step-by-step solution for a thorough understanding of key concepts.
This is a popular solution
Trending nowThis is a popular solution!
Step by stepSolved in 3 steps

Knowledge Booster
Learn more about
Need a deep-dive on the concept behind this application? Look no further. Learn more about this topic, statistics and related others by exploring similar questions and additional content below.Similar questions
- Here's a table with average monthly price of a stock from Jan 2021-July 2021. Month Price Jan 29000 Feb 27000 Mar 31000 Apr 30000 May 32000 June 28000 July 29000 Using a 3-period weighted moving average with weights (wt, wt-1, W-2) = (0.6, 0.2, 0.2), the predicted price August is Using an exponential smoothing model with = 0.4, and with the initial predicted price for Jan the same as the observed price for January, the predicted price for August is % Now, let's suppose that we finally observe that the price for August is 30000. The absolute percent error (APE) of your prediction for August is using the weighted moving average method and % using the exponential smoothing model. (Note: Round your answer to the nearest 2 decimal places. For your APE answer for example let's say you get 0.06786 from Excel, then you should type-in 6.79 as your answer here since it is represented as percentage. Do not enter any symbols other than integers and decimal.)arrow_forwardQ to =://r02.core.learn.edgenuity.com/Player/ ning Unit Test Unit Test Active TIME REMAINING 01:21:21 What is the equation of the least-squares regression An analysis of the decay of 10 grams of an unstable element over time was completed and is displayed in the computer output. line? O Element = 2.305 - 0.101 In(Time) Regression Analysis: In (Element) versus Time Predictor Coef SE Coef O In(Element) = 2.305 - 0.101(Time) Constant 2.305 0.021 109.76 0.000 Time -0.101 0.0007 -132.99 0.000 R-Sq (adj) =0.999 O In(Element) = -0.101 + 2.305 (Time) s=0.0079 R-Sq=0.99 O In(Time) = - 0.101 + 2.305(Element) Save and Exit Next Submit Mark this and return a ch ort sc 144 & 5 L. 8arrow_forwardSuppose you obtain the following regression model, E[y]=91+79*x1 +20*x1*x2. What is the impact of a 39 unit change of x1 on the expected value of y when x2 is at its mean of 40?arrow_forward
- The rumor "People who study math all get scholarships" spreads within a technical high school. Data in the following table show the number of students N who have heard the rumor after t days. 56 7 8 9 10 11 12 Time, t (in days) Number, N, Who Have Heard the Rumor 1 2 3 1 23 3 9 15 21 23 25 25 26 27 a) Use regression to fit a logistic equation N(t)- N(1)= 10-0 (Round to three decimal places as needed) 1. to the data emearrow_forwardSuppose you obtain the following regression model, E[y]=20+53*x +33*x^2. What is the impact of a 63 unit change of x on the expected value of y when x is at its mean of 54?arrow_forwardSuppose you obtain the following regression model, E[y]=20+47*x +88*x^2. What is the impact of a 64 unit change of x on the expected value of y when x is at its mean of 57?arrow_forward
arrow_back_ios
arrow_forward_ios
Recommended textbooks for you
 MATLAB: An Introduction with ApplicationsStatisticsISBN:9781119256830Author:Amos GilatPublisher:John Wiley & Sons Inc
 Probability and Statistics for Engineering and th...StatisticsISBN:9781305251809Author:Jay L. DevorePublisher:Cengage Learning
 Statistics for The Behavioral Sciences (MindTap C...StatisticsISBN:9781305504912Author:Frederick J Gravetter, Larry B. WallnauPublisher:Cengage Learning
 Elementary Statistics: Picturing the World (7th E...StatisticsISBN:9780134683416Author:Ron Larson, Betsy FarberPublisher:PEARSON
 The Basic Practice of StatisticsStatisticsISBN:9781319042578Author:David S. Moore, William I. Notz, Michael A. FlignerPublisher:W. H. Freeman
 Introduction to the Practice of StatisticsStatisticsISBN:9781319013387Author:David S. Moore, George P. McCabe, Bruce A. CraigPublisher:W. H. Freeman

MATLAB: An Introduction with Applications
Statistics
ISBN:9781119256830
Author:Amos Gilat
Publisher:John Wiley & Sons Inc

Probability and Statistics for Engineering and th...
Statistics
ISBN:9781305251809
Author:Jay L. Devore
Publisher:Cengage Learning

Statistics for The Behavioral Sciences (MindTap C...
Statistics
ISBN:9781305504912
Author:Frederick J Gravetter, Larry B. Wallnau
Publisher:Cengage Learning

Elementary Statistics: Picturing the World (7th E...
Statistics
ISBN:9780134683416
Author:Ron Larson, Betsy Farber
Publisher:PEARSON

The Basic Practice of Statistics
Statistics
ISBN:9781319042578
Author:David S. Moore, William I. Notz, Michael A. Fligner
Publisher:W. H. Freeman

Introduction to the Practice of Statistics
Statistics
ISBN:9781319013387
Author:David S. Moore, George P. McCabe, Bruce A. Craig
Publisher:W. H. Freeman