Question

Transcribed Image Text:v(t) (m/s)
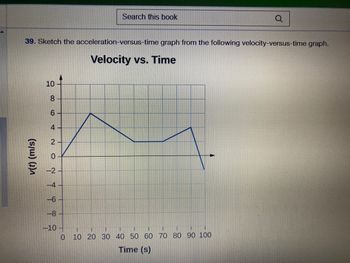
39. Sketch the acceleration-versus-time graph from the following velocity-versus-time graph.
Velocity vs. Time
10
864
2
0
-2.
-4
-6
-8
-10-
0
Search this book
10
Q
1
1
I
20 30 40 50 60 70 80 90 100
Time (s)
Expert Solution
arrow_forward
Step 1
Acceleration is defined as the ratio of velocity with time. In a velocity-time graph, acceleration is given by the slope of the curve. In the given graph, the curves are straight lines. Since straight line has constant slope, the acceleration has constant value along a particular line.
We will first define acceleration in terms of velocity and time, and use this to sketch the required graph. The details are given below.
Step by stepSolved in 3 steps with 1 images

Knowledge Booster
Similar questions
- 31. Sketch the velocity-versus-time Position (m) 10 8 6 4 N -4 -6 -8 -10 0 graph from the following position-versus-time graph. Position vs. Time 1 1 0.2 0.4 0.6 0.8 1 1.2 1.4 1.6 1.8 Time (s) 1 -N 2 32 Sketch the velocity-versus-time graph from the following position-versus-time graph.arrow_forward5. DETERMINE THE STOPPING DISTANCES FOR A CAR WITH AN INITIAL SPEED OF 95km/h AND A HUMAN REACTION TIME OF 1.0 s, FOR AN ACCELERATION OF............. (A) a=-4.0 m/s², (B) a= -8.0 m/s² (Hint: First, convert 95 km/h to m/s)arrow_forward7arrow_forward
- 13. A boy walks 155 m at a speed of 3.5 m/s and then runs for 100 m at 8.2 m/s along a straight line. Calculate his average velocity. 14.A boat can accelerate from 2 to 21 km/h in 10 s. How far has the boat travelled in this time?arrow_forward42arrow_forwardWhat is the acceleration at 8.2 s?arrow_forward
- 9arrow_forward5. Your motion along the x-axis begins at rest and at x= 0. The motion consists of acceleration at 2.00 m/s2for 10.0 s, a time period of 6.00 seconds with no acceleration, and then deceleration at -1.00 m/s2for 20.0 s resulting in a final speed of zero. The total distance traveled is 420 m. What is the average speed during this motion? Give answer to 3 significant figures. Help solve this problem, thanks!arrow_forward60 Determine the following: 50 9. During which periods was there positive acceleration? 40 30 20 10. During which periods was there negative acceleration? 10 0 5 10 15 20 25 30 35 40 45 50 55 60 T (s) 11. During which periods was there no acceleration? 12. What was the greatest negative acceleration? 13. How far did this object travel in total? (su) Aarrow_forward
- 2. Can an object with a velocity of zero experience an acceleration that is nonzero? Explain. 3. A ball is held in a person's hand. 53% Prsic 8A 令arrow_forward7. Is it possible for an object to have zero velocity but still have an acceleration? If so, give an example. If not, explain why not.arrow_forwardStudy the velocity-time graph pictured below and sketch a corresponding position-time graph and acceleration-time graph. velocity (m/sec) ܚ ܚ ܝ ܘ ܝ ܬ ܚ ܟ ܗ ܬ -4 -5 -6 -7 5 10 time (sec) 15 20arrow_forward
arrow_back_ios
arrow_forward_ios