
MATLAB: An Introduction with Applications
6th Edition
ISBN: 9781119256830
Author: Amos Gilat
Publisher: John Wiley & Sons Inc
expand_more
expand_more
format_list_bulleted
Related questions
Topic Video
Question
Speed Dating Data Set 18 “Speed Dating” in Appendix B lists attribute ratings of females by males who participated in speed dating
StatCrunch
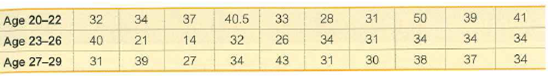

Transcribed Image Text:39
Age 20-22
Age 23-26
Age 27-29
40.5
41
37
33
28
31
32
34
26
40
32
31
34
30
34
34
34
21
14
38
37
27
34
43
31
31
39
34
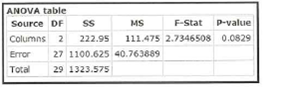
Transcribed Image Text:ANOVA table
F-Stat
111.475 2.7346508 0.0829
P-value
Source DF
Columns 2 222.95
MS
27 1100.625 40.763889
29 1323.575
Error
Total
Expert Solution
This question has been solved!
Explore an expertly crafted, step-by-step solution for a thorough understanding of key concepts.

This is a popular solution

Trending nowThis is a popular solution!

Step by stepSolved in 3 steps

Knowledge Booster


Learn more about
Need a deep-dive on the concept behind this application? Look no further. Learn more about this topic, statistics and related others by exploring similar questions and additional content below.Similar questions
- Researchers want to know if a tutoring program affects students’ ACT scores. They used a sample of twenty students and tested them before and after the tutoring program. Use Excel to perform a dependent sample t-test to determine whether the difference between the mean pretest score and the mean posttest score is significantly different. Assume unequal variance. Subject Pretest Posttest 1 21 25 2 30 33 3 25 26 4 28 31 5 31 34 6 16 16 7 19 21 8 21 24 9 26 27 10 34 34 11 22 23 12 18 24 13 14 17 14 19 23 15 24 25 16 33 30 17 25 27 18 26 26 19 22 24 20 19 18arrow_forwardThe following table shows a sample dataset of observation values of an independent variable, Age, and a dependent variable, number of toys Age 5 3 6 3 4 4 6 8 Toys 13 15 7 12 13 11 9 5 What is the value of Toys when Age is 7 (round your answer without decimal)arrow_forwardCustomers waiting at Ellerton Bank have been complaining about the amount of time they must wait in line. Managers at the bank, beginning to investigate the problem, have recorded sample waiting times for 10 customers at the bank. Here are the 10 waiting times (in minutes). 22, 11, 15, 15, 16, 12, 23, 20, 22, 10 Send data to calculator (a) What is the median of this data set? If your answer is not an integer, round your answer to one decimal place. (b) What is the mean of this data set? If your answer is not an integer, round your answer to one decimal place. (c) How many modes does the data set have, and what are their values? Indicate the number of modes by clicking in the appropriate circle, and then indicate the value(s) of the mode(s), if applicable. 0 0 zero modes O one mode: two modes: O Dar andarrow_forward
- O Macmillan Learning The domestic cat, Felis catus, is a domesticated furry creature often kept as a pet in many countries. Suppose a volunteer at a local animal shelter wanted to find out a little more about the cats in her care. The volunteer carefully measured the height for the 10 fully grown adult cats at her shelter. The height measurements were taken from the base of the foreleg to the shoulder. The table shows the results of the measurements. Calculate the mean, variance, and standard deviations for cat height for the sample of shelter cats. Report all your answers to two decimal points. mean: variance: standard deviation: in in² in Sample 1 2 3 4 5 6 7 8 9 10 Height (in) 10.5 13 7.7 7.5 9.55 10.5 10.85 12.3 8.15 7.85arrow_forwardA certain statistics instructor participates in triathlons. The accompanying table lists times (in minutes and seconds) he recorded while riding a bicycle for five laps through each mile of a 3-mile loop. Use a 0.05 significance level to test the claim that it takes the same time to ride each of the miles. Does one of the miles appear to have a hill? LOADING... Click the icon to view the data table of the riding times. Question content area bottom Part 1 Determine the null and alternative hypotheses. H0: ▼ mu 1 greater than mu 2 greater than mu 3μ1>μ2>μ3 mu 1 not equals mu 2 not equals mu 3μ1≠μ2≠μ3 Exactly two of the population means are different from each other.Exactly two of the population means are different from each other. At least one of the three population means is different from the others.At least one of the three population means is different from the others. mu 1 equals mu 2 equals mu 3μ1=μ2=μ3 H1: ▼ mu 1 greater than mu 2…arrow_forwardwhat is the answer?arrow_forward
- The Analysis of Variance. A research study compared beer consumed daily between 3 groups with 3 observations each. Group1 was UCB, Group 2 UCSD, and Group 3 UCI. Determine if there is a significant difference among the groups 5% level. Group1: UCB Group 2: UCSD Group 3: UCI The Results of this study are in the following table: Group1 Group2 Group3 Sample 3, 4, 5 3.2, 4, 4.2 3, 4, 3.3 Mean 4.0 3.7 3.4 S^2 4.4 5.2 6.1 null and alternative hypotheses are Null hypothesis Ho : There is a significant difference among the treatment group means Alternative Hypothesis Ha : At least one group mean is different from other group means the average mean due to treatments are…arrow_forwardplease assist I am lostarrow_forward
arrow_back_ios
arrow_forward_ios
Recommended textbooks for you
- MATLAB: An Introduction with ApplicationsStatisticsISBN:9781119256830Author:Amos GilatPublisher:John Wiley & Sons Inc
 Probability and Statistics for Engineering and th...StatisticsISBN:9781305251809Author:Jay L. DevorePublisher:Cengage Learning
 Statistics for The Behavioral Sciences (MindTap C...StatisticsISBN:9781305504912Author:Frederick J Gravetter, Larry B. WallnauPublisher:Cengage Learning
  Elementary Statistics: Picturing the World (7th E...StatisticsISBN:9780134683416Author:Ron Larson, Betsy FarberPublisher:PEARSON
 The Basic Practice of StatisticsStatisticsISBN:9781319042578Author:David S. Moore, William I. Notz, Michael A. FlignerPublisher:W. H. Freeman
 Introduction to the Practice of StatisticsStatisticsISBN:9781319013387Author:David S. Moore, George P. McCabe, Bruce A. CraigPublisher:W. H. Freeman
MATLAB: An Introduction with Applications
Statistics
ISBN:9781119256830
Author:Amos Gilat
Publisher:John Wiley & Sons Inc
Probability and Statistics for Engineering and th...
Statistics
ISBN:9781305251809
Author:Jay L. Devore
Publisher:Cengage Learning
Statistics for The Behavioral Sciences (MindTap C...
Statistics
ISBN:9781305504912
Author:Frederick J Gravetter, Larry B. Wallnau
Publisher:Cengage Learning
Elementary Statistics: Picturing the World (7th E...
Statistics
ISBN:9780134683416
Author:Ron Larson, Betsy Farber
Publisher:PEARSON
The Basic Practice of Statistics
Statistics
ISBN:9781319042578
Author:David S. Moore, William I. Notz, Michael A. Fligner
Publisher:W. H. Freeman
Introduction to the Practice of Statistics
Statistics
ISBN:9781319013387
Author:David S. Moore, George P. McCabe, Bruce A. Craig
Publisher:W. H. Freeman