MATLAB: An Introduction with Applications
6th Edition
ISBN: 9781119256830
Author: Amos Gilat
Publisher: John Wiley & Sons Inc
expand_more
expand_more
format_list_bulleted
Question
thumb_up100%
Can you explain 3.32? Thank you

Transcribed Image Text:Page 230
of
the popuration parameter and use appropriate
notation for your answer.
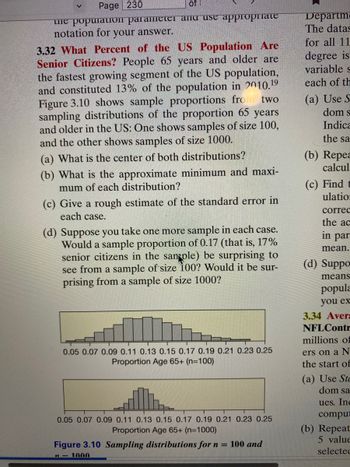
3.32 What Percent of the US Population Are
Senior Citizens? People 65 years and older are
the fastest growing segment of the US population,
and constituted 13% of the population in 2010.19
Figure 3.10 shows sample proportions fro
sampling distributions of the proportion 65 years
and older in the US: One shows samples of size 100,
and the other shows samples of size 1000.
two
(a) What is the center of both distributions?
(b) What is the approximate minimum and maxi-
mum of each distribution?
(c) Give a rough estimate of the standard error in
each case.
(d) Suppose you take one more sample in each case.
Would a sample proportion of 0.17 (that is, 17%
senior citizens in the san ple) be surprising to
see from a sample of size 100? Would it be sur-
prising from a sample of size 1000?
0.05 0.07 0.09 0.11 0.13 0.15 0.17 0.19 0.21 0.23 0.25
Proportion Age 65+ (n=100)
0.05 0.07 0.09 0.11 0.13 0.15 0.17 0.19 0.21 0.23 0.25
Proportion Age 65+ (n=1000)
Figure 3.10 Sampling distributions for n = 100 and
n-1000
Departm
The datas
for all 11
degree is
variable s
each of th
(a) Use S
dom s
Indica
the sa
(b) Repea
calcul
(c) Find t
ulation
correc
the ac
in par
mean.
(d) Suppo
means
popula
you ex
3.34 Avera
NFL Contr
millions of
ers on a N
the start of
(a) Use Ste
dom sa
ues. Inc
comput
(b) Repeat
5 value
selected
Expert Solution
This question has been solved!
Explore an expertly crafted, step-by-step solution for a thorough understanding of key concepts.
This is a popular solution
Trending nowThis is a popular solution!
Step by stepSolved in 2 steps

Knowledge Booster
Similar questions
- 3D2 waluate the following. lick on "Not a real numb -81 %3D (a)arrow_forwardCan you please explain how you got .235 from the chi-square table? I am having trouble using the table. Thank you so much.arrow_forwardQ3: Multiple regression using Minitab. interpret the results in bullets step by step Regression Analysis: y versus x1, x2 Regression Equation y 18.4+ 2.010 x1 + 4. 738 x2 Coefficients Term Constant x1 x2 Model Summary Coef -18.4 2.010 4.738 S 12. 7096 Analysis of Variance 1 R-sq 92.55% SE Coef 18.0 0.247 0.948 + T-Value -1.02 8. 13 5.00 R-sq(adj) 90.42% Source DF Adj SS Adj MS F-Value P-Value Regression 2 14052 7026.1 43.50 0.000 x1 1 10689 10688.7 66.17 0.000 x2 4031 4030,9 24.95 0.002 P-Value VIF 0.341 0.000 1.00 0.002 1.00 R-sq(pred) 87.95% + 5arrow_forward
arrow_back_ios
arrow_forward_ios
Recommended textbooks for you
 MATLAB: An Introduction with ApplicationsStatisticsISBN:9781119256830Author:Amos GilatPublisher:John Wiley & Sons Inc
 Probability and Statistics for Engineering and th...StatisticsISBN:9781305251809Author:Jay L. DevorePublisher:Cengage Learning
 Statistics for The Behavioral Sciences (MindTap C...StatisticsISBN:9781305504912Author:Frederick J Gravetter, Larry B. WallnauPublisher:Cengage Learning
 Elementary Statistics: Picturing the World (7th E...StatisticsISBN:9780134683416Author:Ron Larson, Betsy FarberPublisher:PEARSON
 The Basic Practice of StatisticsStatisticsISBN:9781319042578Author:David S. Moore, William I. Notz, Michael A. FlignerPublisher:W. H. Freeman
 Introduction to the Practice of StatisticsStatisticsISBN:9781319013387Author:David S. Moore, George P. McCabe, Bruce A. CraigPublisher:W. H. Freeman

MATLAB: An Introduction with Applications
Statistics
ISBN:9781119256830
Author:Amos Gilat
Publisher:John Wiley & Sons Inc

Probability and Statistics for Engineering and th...
Statistics
ISBN:9781305251809
Author:Jay L. Devore
Publisher:Cengage Learning

Statistics for The Behavioral Sciences (MindTap C...
Statistics
ISBN:9781305504912
Author:Frederick J Gravetter, Larry B. Wallnau
Publisher:Cengage Learning

Elementary Statistics: Picturing the World (7th E...
Statistics
ISBN:9780134683416
Author:Ron Larson, Betsy Farber
Publisher:PEARSON

The Basic Practice of Statistics
Statistics
ISBN:9781319042578
Author:David S. Moore, William I. Notz, Michael A. Fligner
Publisher:W. H. Freeman

Introduction to the Practice of Statistics
Statistics
ISBN:9781319013387
Author:David S. Moore, George P. McCabe, Bruce A. Craig
Publisher:W. H. Freeman