
MATLAB: An Introduction with Applications
6th Edition
ISBN: 9781119256830
Author: Amos Gilat
Publisher: John Wiley & Sons Inc
expand_more
expand_more
format_list_bulleted
Related questions
Concept explainers
Question
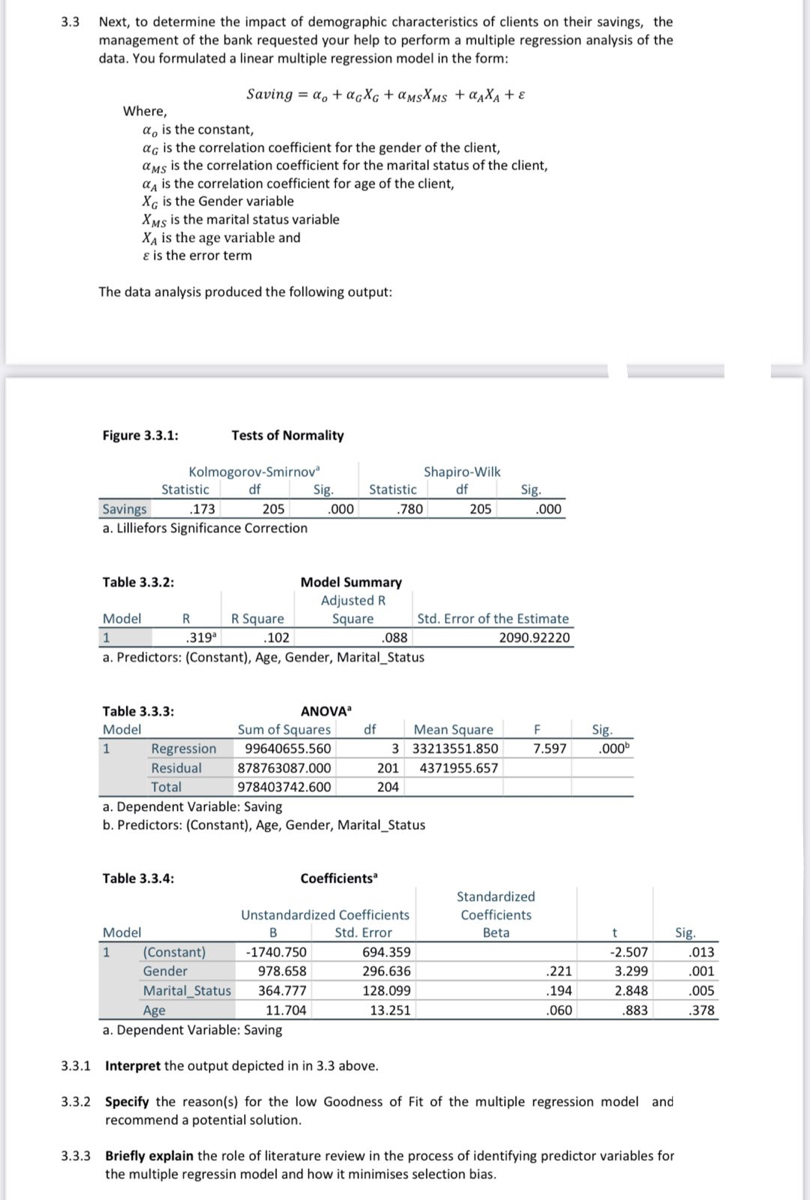

Transcribed Image Text:3.3 Next, to determine the impact of demographic characteristics of clients on their savings, the
management of the bank requested your help to perform a multiple regression analysis of the
data. You formulated a linear multiple regression model in
form:
Saving = a, + acXg + amsXms + a¾Xa + ɛ
Where,
a, is the constant,
aç is the correlation coefficient for the gender of the client,
aMs is the correlation coefficient for the marital status of the client,
a, is the correlation coefficient for age of the client,
Xg is the Gender variable
XMs is the marital status variable
XA is the age variable and
e is the error term
The data analysis produced the following output:
Figure 3.3.1:
Tests of Normality
Kolmogorov-Smirnov
Sig.
Shapiro-Wilk
Statistic
df
Statistic
Sig.
Savings
a. Lilliefors Significance Correction
.173
205
.000
780
205
.000
Model Summary
Adjusted R
Square
Table 3.3.2:
Model
R Square
Std. Error of the Estimate
319
.102
.088
2090.92220
a. Predictors: (Constant), Age, Gender, Marital_Status
Table 3.3.3:
ANOVA
Model
Sum of Squares
df
Mean Square
F
Sig.
Regression
99640655.560
3 33213551.850
7.597
.000
Residual
878763087.000
201
4371955.657
Total
978403742.600
204
a. Dependent Variable: Saving
b. Predictors: (Constant), Age, Gender, Marital_Status
Table 3.3.4:
Coefficients
Standardized
Unstandardized Coefficients
Coefficients
Model
B
Std. Error
Beta
Sig.
(Constant)
-1740.750
694.359
-2.507
.013
Gender
978.658
296.636
.221
3.299
.001
Marital_Status
364.777
128.099
.194
2.848
.005
11.704
Age
a. Dependent Variable: Saving
13.251
.060
.883
.378
3.3.1 Interpret the output depicted in in 3.3 above.
3.3.2 Specify the reason(s) for the low Goodness of Fit of the multiple regression model and
recommend a potential solution.
3.3.3 Briefly explain the role of literature review in the process of identifying predictor variables for
the multiple regressin model and how it minimises selection bias.
Expert Solution
This question has been solved!
Explore an expertly crafted, step-by-step solution for a thorough understanding of key concepts.

This is a popular solution

Trending nowThis is a popular solution!

Step by stepSolved in 2 steps

Knowledge Booster


Learn more about
Need a deep-dive on the concept behind this application? Look no further. Learn more about this topic, statistics and related others by exploring similar questions and additional content below.Similar questions
- Suppose a doctor measures the height, x, and head circumference, y, of 8 children and obtains the data below. Thecorrelation coefficient is 0.944 and the least squares regression line is y = 0.199x + 11.982. Complete parts (a) and (b)below.Height, x27.5 25.5 26.25 25.25 27.5 26.25 26 27.25 27.25 27 27.25 ФHead Circumference, # 17.5 17.0 17.2 17.0 17.5 17.3 17.2 17.4 17.3 17.3 17.4(a) Compute the coefficient of determination, R?R?.% (Round to one decimal place as needed.)(b) Interpret the coefficient of determination and comment on the adequacy of the linear model.Approximately % of the variation inis explained by the least-squares regression model.According to the residual plot, the linear model appears to be (Round to one decimal place as needed.)arrow_forwardANSWER THE FOLLOWING QUESTION.arrow_forwardx 5.7 4.1 6.2 4.4 6.5 5.8 4.9 y 1.9 4.8 0.8 3.9 1.2 1.7 3.0 (a) Computethecoefficientofdetermination. (b) Howmuchofthevariationintheoutcomevariableisexplainedbytheleast-squares regression line?arrow_forward
- The age (in weeks) and the number of hours slept in a day were recorded for arandom sample of 8 infants.Age (in weeks) 5 10 15 22 26 36 42 47Hours slept ina day14.9 14.5 14.7 14.2 13.4 14.1 13.4 13.7(a) Find the regression line that predicts the number of hours an infant sleeps ina day based on its age (in weeks).(b) How well does the regression line fit the data? Use words and statistics tosupport your answer.(c) Predict the number of hours that a 30-week-old infant would sleep in a day.Use words to state your answer.arrow_forwardAn engineer wants to determine how the weight of a gas-powered car, x, affects gas mileage, y. The accompanying data represent the weights of various domestic cars and their miles per gallon in the city for the most recent model year. Complete parts (a) Find the least-squares regression line treating weight as the explanatory variable and miles per gallon as the response variable.arrow_forward5arrow_forward
- Show calculations or explanation for each question. a) Which of the following techniques is used to predict the value of one variable on thebasis of other variables?a. Correlation analysisb. Coefficient of correlationc. Covarianced. Regression analysis b) In the least squares regression line, y^=3-2x the predicted value of y equals:a. 1.0 when x = −1.0b. 2.0 when x = 1.0c. 2.0 when x = −1.0d. 1.0 when x = 1.0 c) In the simple linear regression model, the y-intercept represents the:a. change in y per unit change in x.b. change in x per unit change in y.c. value of y when x = 0.d. value of x when y = 0.arrow_forwardThe data from exercise 3 follow. xi 2 6 9 13 20 yi 7 18 9 26 23 The estimated regression equation is = 7.6 + .9x. What is the value of the standard error of the estimate (to 4 decimals)? What is the value of the t test statistic (to 2 decimals)? What is the p-value? Use Table 1 of Appendix B.Selectless than .01between .01 and .02between .02 and .05between .05 and .10between .10 and .20between .20 and .40greater than .40Item 3 What is your conclusion ( = .05)?SelectConclude a significant relationship exists between x and yCannot conclude a significant relationship exists between x and yItem 4 Use the F test to test for a significant relationship. Use = .05.Compute the value of the F test statistic (to 2 decimals). What is the p-value?Selectless than .01between .01 and .025between .025 and .05between .05 and .10greater than .10Item 6 What is your conclusion?SelectConclude a significant relationship exists between x and yCannot conclude a significant relationship exists…arrow_forwardAn administrator wants to investigate the relationship between the numbers of unauthorized days that employees are absent per year and the distance (miles) between home and work for the employees. A sample of 10 employees was chosen, and the following data were collected. Distance to Work (miles) 2 4 6 6 9 8 10 12 12 15 Number of Days Absent 8 5 8 6 6 4 6 3 5 3 Develop the least square regression line to predict the number of days absent based on the distance to work. Enter the regression coefficients in xx.xxx format. Round the value to three decimals and use leading and trailing zero to exactly match the format. Include the negative sign (minus sign) if the coefficient is negative. Do not include plus sign in your response. For example, if the coefficient is +6.1563 then enter 06.156 as your answer, if the coefficient is -0.54765 then enter -00.548 and if the answer is -1.6435 then enter -01.644 Ŷ=b0+b1X Constant/intercept…arrow_forward
arrow_back_ios
arrow_forward_ios
Recommended textbooks for you
- MATLAB: An Introduction with ApplicationsStatisticsISBN:9781119256830Author:Amos GilatPublisher:John Wiley & Sons Inc
 Probability and Statistics for Engineering and th...StatisticsISBN:9781305251809Author:Jay L. DevorePublisher:Cengage Learning
 Statistics for The Behavioral Sciences (MindTap C...StatisticsISBN:9781305504912Author:Frederick J Gravetter, Larry B. WallnauPublisher:Cengage Learning
  Elementary Statistics: Picturing the World (7th E...StatisticsISBN:9780134683416Author:Ron Larson, Betsy FarberPublisher:PEARSON
 The Basic Practice of StatisticsStatisticsISBN:9781319042578Author:David S. Moore, William I. Notz, Michael A. FlignerPublisher:W. H. Freeman
 Introduction to the Practice of StatisticsStatisticsISBN:9781319013387Author:David S. Moore, George P. McCabe, Bruce A. CraigPublisher:W. H. Freeman
MATLAB: An Introduction with Applications
Statistics
ISBN:9781119256830
Author:Amos Gilat
Publisher:John Wiley & Sons Inc
Probability and Statistics for Engineering and th...
Statistics
ISBN:9781305251809
Author:Jay L. Devore
Publisher:Cengage Learning
Statistics for The Behavioral Sciences (MindTap C...
Statistics
ISBN:9781305504912
Author:Frederick J Gravetter, Larry B. Wallnau
Publisher:Cengage Learning
Elementary Statistics: Picturing the World (7th E...
Statistics
ISBN:9780134683416
Author:Ron Larson, Betsy Farber
Publisher:PEARSON
The Basic Practice of Statistics
Statistics
ISBN:9781319042578
Author:David S. Moore, William I. Notz, Michael A. Fligner
Publisher:W. H. Freeman
Introduction to the Practice of Statistics
Statistics
ISBN:9781319013387
Author:David S. Moore, George P. McCabe, Bruce A. Craig
Publisher:W. H. Freeman