MATLAB: An Introduction with Applications
6th Edition
ISBN: 9781119256830
Author: Amos Gilat
Publisher: John Wiley & Sons Inc
expand_more
expand_more
format_list_bulleted
Question
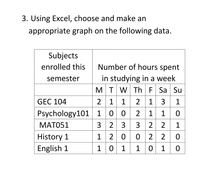
Hi! Can you show me the appropriate chart/data presentation that I could use for this data set?

Transcribed Image Text:3. Using Excel, choose and make an
appropriate graph on the following data.
Subjects
enrolled this
Number of hours spent
in studying in a week
MTW Th F Sa Su
semester
GEC 104
2 1 1 2 1 3 1
Psychology101 100 2 1 1 0
3 2
3 3 2 2
MAT051
1
0 0 2
2 0
10 1
History 1
1 2
English 1
1 0 1
Expert Solution
This question has been solved!
Explore an expertly crafted, step-by-step solution for a thorough understanding of key concepts.
This is a popular solution
Trending nowThis is a popular solution!
Step by stepSolved in 3 steps with 2 images

Knowledge Booster
Similar questions
- Data: 3.5, 3.2, 3.1, 3.5, 3.6, 3.2, 3.4, 2.9, 4.1, 2.6, 3.3, 3.5, 3.9, 3.8, 3.7, 3.4, 3.6, 3.5, 3.5, 3.7, 3.6, 3.8, 3.2, 3.4, 4.2, 3.6, 3.1, 2.9, 2.5, 3.5, 3.1, 3.2, 3.7, 3.8, 3.4, 3.6, 3.5, 3.2, 3.6, 3.8 Sketch a histogram with ranges of 0.1, from minimum (2.5) to maximum (4.2) values. Then sketch a histogram with ranges of 0.3. You can include the relative frequency scales on the same sketches.arrow_forwardList an advatge of microdata, and of aggregated data Answer in a few sentences thank you.arrow_forwardPlease produce descriptive statistics for this data setarrow_forward
- A back-to-back stem-and-leaf plot compares two data sets by using the same stems for each data set. Leaves for the first data set are on one side while leaves for the second data set are on the other side. The back-to-back stem- and-leaf plot available below shows the salaries (in thousands) of all lawyers at two small law firms. Complete parts (a) and (b) below. Click the icon to view the back-to-back stem-and-leaf plot. (a) What are the lowest and highest salaries at Law Firm A? at Law Firm B? How many lawyers are in each firm? At Law Firm A the lowest salary was $ At Law Firm B the lowest salary was $ and the highest salary was $ and the highest salary was $arrow_forwarddoes the interquartile range of a data set affect the way the data is graphed?arrow_forwardPlease anwser using SPSS!arrow_forward
- Continue monitoring the process. A second ten days of data have been collected, see table labeled “2nd 10 Days of Monitoring Reservation Processing Time” in the Data File. Develop Xbar and R charts for the 2nd 10 days of monitoring. Plot the data for the 2nd 10 days on the Xbar and R charts. Is the reservation process for the 2nd 10 days of monitoring in control? If the control chart indicates an out-of-control process, note which days, the pattern, and whether it is the Xbar or R chart. Based on the X-bar and R Charts that you developed for the 2nd 10 days of data, is the process in control? Group of answer choices No. The X-bar and R Charts are both out of control. No. The X-bar Chart is in control, but the R Chart is out of control. No. The R Chart is in control, but the X-bar Chart is out of control. Yes. The X-bar and R Charts are both in control.arrow_forwardUse the given minimum and maximum data entries, and the number of classes, to find the class width, the lower class limits, and the upper class limits. minimum=9, maximum=53, 7 classes. What is the class width?arrow_forward
arrow_back_ios
arrow_forward_ios
Recommended textbooks for you
 MATLAB: An Introduction with ApplicationsStatisticsISBN:9781119256830Author:Amos GilatPublisher:John Wiley & Sons Inc
 Probability and Statistics for Engineering and th...StatisticsISBN:9781305251809Author:Jay L. DevorePublisher:Cengage Learning
 Statistics for The Behavioral Sciences (MindTap C...StatisticsISBN:9781305504912Author:Frederick J Gravetter, Larry B. WallnauPublisher:Cengage Learning
 Elementary Statistics: Picturing the World (7th E...StatisticsISBN:9780134683416Author:Ron Larson, Betsy FarberPublisher:PEARSON
 The Basic Practice of StatisticsStatisticsISBN:9781319042578Author:David S. Moore, William I. Notz, Michael A. FlignerPublisher:W. H. Freeman
 Introduction to the Practice of StatisticsStatisticsISBN:9781319013387Author:David S. Moore, George P. McCabe, Bruce A. CraigPublisher:W. H. Freeman

MATLAB: An Introduction with Applications
Statistics
ISBN:9781119256830
Author:Amos Gilat
Publisher:John Wiley & Sons Inc

Probability and Statistics for Engineering and th...
Statistics
ISBN:9781305251809
Author:Jay L. Devore
Publisher:Cengage Learning

Statistics for The Behavioral Sciences (MindTap C...
Statistics
ISBN:9781305504912
Author:Frederick J Gravetter, Larry B. Wallnau
Publisher:Cengage Learning

Elementary Statistics: Picturing the World (7th E...
Statistics
ISBN:9780134683416
Author:Ron Larson, Betsy Farber
Publisher:PEARSON

The Basic Practice of Statistics
Statistics
ISBN:9781319042578
Author:David S. Moore, William I. Notz, Michael A. Fligner
Publisher:W. H. Freeman

Introduction to the Practice of Statistics
Statistics
ISBN:9781319013387
Author:David S. Moore, George P. McCabe, Bruce A. Craig
Publisher:W. H. Freeman