
MATLAB: An Introduction with Applications
6th Edition
ISBN: 9781119256830
Author: Amos Gilat
Publisher: John Wiley & Sons Inc
expand_more
expand_more
format_list_bulleted
Related questions
Question
Lesson:
Hypothesis Testing:
Testing the Population Mean
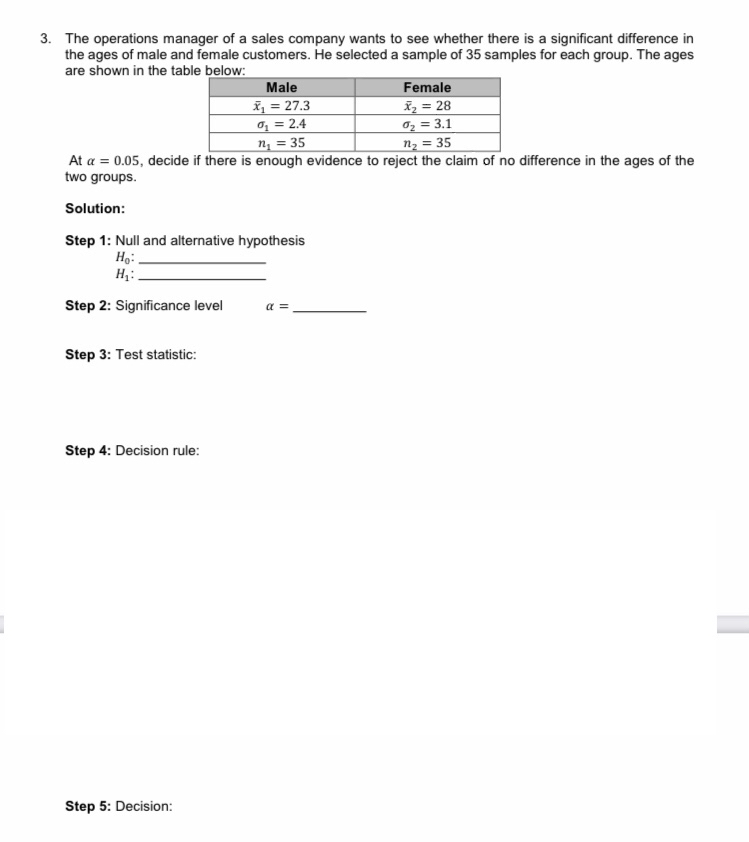

Transcribed Image Text:3. The operations manager of a sales company wants to see whether there is a significant difference in
the ages of male and female customers. He selected a sample of 35 samples for each group. The ages
are shown in the table below:
Male
x₁ = 27.3
Female
x₂ = 28
%₂= 3.1
o₂ = 2.4
n₁ = 35
n₂ = 35
At a = 0.05, decide if there is enough evidence to reject the claim of no difference in the ages of the
two groups.
Solution:
Step 1: Null and alternative hypothesis
H₂:
H₂:
Step 2: Significance level
α =
Step 3: Test statistic:
Step 4: Decision rule:
Step 5: Decision:
Expert Solution
This question has been solved!
Explore an expertly crafted, step-by-step solution for a thorough understanding of key concepts.

Step by stepSolved in 2 steps

Knowledge Booster

Similar questions
- Hi could you fill out the blanks?arrow_forwardUsing the following information: identify the population, sample, statistic, and parameter. Political pollsters are often interested in gaining information about the proportion of Americans who will vote for a candidate before the actual election. One group of pollsters conducted a survey of 50,000 people to find out if they planned on voting for Trump in the next presidential election.arrow_forwardNeed to understand how to solve in excel or using megastat. This is practice exam Suppose Bank of America would like to investigate if the credit score and income level of an individual are independent of one another. Bank of America selected a random sample of 400 adults and asked them to report their credit score range and their income range. The following contingency table presents these results. Credit Score Class Less than 650 650–750 More than 750 Income < $50,000 30 24 27 $50,000 ≤ Income < $100,000 42 47 38 $100,000 ≤ Income < $150,000 49 35 26 Income ≥ $150,000 27 29 26 The expected number of individuals with income between $50,000 and $100,000 and a credit score less than 650 is ________. Multiple Choice 23.5 26.0 31.0 47.0arrow_forward
- Help!arrow_forwardMultiple Choice Question A study took a random sample of adults and asked them about their bedtime habits. The data showed that people who drank a cup of tea before bedtime were more likely to go to sleep earlier than those who didn't drink tea. What was the independent (explanatory variable) in this study? A. Whether or not the person drank tea B. When the person went to sleep C. The adults D. Bedtime habitsarrow_forwardTask-1. Define the terms Population and Sample, why sampling is done and what are the characteristics of a good sample. Include examples, preferably with an engineering background.arrow_forward
- Net Worth. The Board of Governors of the Federal Reserve System publishes information on family net worth in the Survey of Consumer Finances. In 2010, the mean net worth of families in the United States was $498.8 thousand and the median net worth was $77.3 thousand. Which measure of center do you think is more appropriate? Explain your answer.arrow_forwardYou are testing the claim that the proportion of men who own cats is larger than the proportion of women who own cats.You sample 200 men, and 20% own cats.You sample 120 women, and 75% own cats. Find the test statisticarrow_forward
arrow_back_ios
arrow_forward_ios
Recommended textbooks for you
- MATLAB: An Introduction with ApplicationsStatisticsISBN:9781119256830Author:Amos GilatPublisher:John Wiley & Sons Inc
 Probability and Statistics for Engineering and th...StatisticsISBN:9781305251809Author:Jay L. DevorePublisher:Cengage Learning
 Statistics for The Behavioral Sciences (MindTap C...StatisticsISBN:9781305504912Author:Frederick J Gravetter, Larry B. WallnauPublisher:Cengage Learning
  Elementary Statistics: Picturing the World (7th E...StatisticsISBN:9780134683416Author:Ron Larson, Betsy FarberPublisher:PEARSON
 The Basic Practice of StatisticsStatisticsISBN:9781319042578Author:David S. Moore, William I. Notz, Michael A. FlignerPublisher:W. H. Freeman
 Introduction to the Practice of StatisticsStatisticsISBN:9781319013387Author:David S. Moore, George P. McCabe, Bruce A. CraigPublisher:W. H. Freeman
MATLAB: An Introduction with Applications
Statistics
ISBN:9781119256830
Author:Amos Gilat
Publisher:John Wiley & Sons Inc
Probability and Statistics for Engineering and th...
Statistics
ISBN:9781305251809
Author:Jay L. Devore
Publisher:Cengage Learning
Statistics for The Behavioral Sciences (MindTap C...
Statistics
ISBN:9781305504912
Author:Frederick J Gravetter, Larry B. Wallnau
Publisher:Cengage Learning
Elementary Statistics: Picturing the World (7th E...
Statistics
ISBN:9780134683416
Author:Ron Larson, Betsy Farber
Publisher:PEARSON
The Basic Practice of Statistics
Statistics
ISBN:9781319042578
Author:David S. Moore, William I. Notz, Michael A. Fligner
Publisher:W. H. Freeman
Introduction to the Practice of Statistics
Statistics
ISBN:9781319013387
Author:David S. Moore, George P. McCabe, Bruce A. Craig
Publisher:W. H. Freeman