
MATLAB: An Introduction with Applications
6th Edition
ISBN: 9781119256830
Author: Amos Gilat
Publisher: John Wiley & Sons Inc
expand_more
expand_more
format_list_bulleted
Related questions
Question
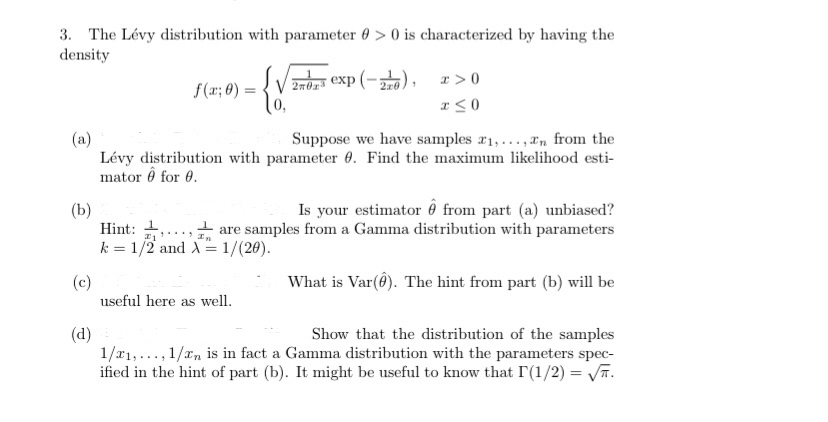

Transcribed Image Text:3. The Lévy distribution with parameter 0> 0 is characterized by having the
density
(b)
(a)
Suppose we have samples 1,...,n from the
Lévy distribution with parameter 0. Find the maximum likelihood esti-
mator @ for 0.
(c)
f(x; 0):
(d)
20x3 exp(-26), x>0
x≤0
Is your estimator from part (a) unbiased?
1 are samples from a Gamma distribution with parameters
Hint:
#1 In
k = 1/2 and X = 1/(20).
useful here as well.
What is Var(). The hint from part (b) will be
Show that the distribution of the samples
1/21,..., 1/xn is in fact a Gamma distribution with the parameters spec-
ified in the hint of part (b). It might be useful to know that I(1/2) = √√.
Expert Solution
This question has been solved!
Explore an expertly crafted, step-by-step solution for a thorough understanding of key concepts.

This is a popular solution

Trending nowThis is a popular solution!

Step by stepSolved in 5 steps

Knowledge Booster

Similar questions
- A normal distribution has a mean of μμ= 54 and a standard deviation of σσ=6 What is the probability of randomly selecting a score GREATER than 51? A normal distribution has a mean of μμ= 54 and a standard deviation of σσ=6 What is the probability of selecting a sample of n = 4 scores with a mean more than M = 51? A normal distribution has a mean of μμ= 54 and a standard deviation of σσ=6 What is the probability of selecting a sample of n = 36 scores with a mean more than M = 51?arrow_forwardWhat is the variance and standard deviation for the number of times the SAT is taken? x Frequency (f) fx f*x2= (f*x) x (x) (4) = (3)x(1) 5152727-(2547473)(2547473)/1518859=880035.3688/1518859=0.5794 (1) (2) (3)=(1)x(2) (4)=(3x1) Population Variance 1 721,769 721,769 721,769 2 601,325 1,202,650 2,405,300 3 166,736 500,208 1,500,624 4 22,299 89,196 356,784 5 6,730 33,650 168,250 Total 1,518,859 2,547,473 5,152,727 880035.3688 0.5794 n=1,518,859 ∑fx = 2,547,473 The population variance is 0.5794 The Standard Deviation? 0.76 Can you show me the steps to reach the standard deviation of .76 ?arrow_forwardIf we assume that the distribution of means is normal, then 95% of all sample means a) will fall in the interval m ± 1.96(σm) b) will fall in the interval m ± 1.645(σm) c) will be no more than 1.645(σm) from μ d) will be no more than from 1.96(σm) from μarrow_forward
- 3) Suppose test scores are measured by the Gaussian Normal Distribution N(X,75,10) calculate the following. a) Pr(80 < X < 90) b) Pr(50 < X < 70) c) The 95 th percentilearrow_forward1. In the past, a chemical company produced 880 pounds of a certain type of plastic per day. Now, using a newly developed and less expensive process, the mean daily yield of plastic for the first 50 days of production is 871 pounds; the standard deviation is 21 pounds. Do the data provide sufficient evidence to indicate that the mean daily yield for the new process is less than that of the old procedure? (Use α=0.05) (d) Conclusion of the test above is Reject the null hypothesis and the mean daily yield for the new process is less than that of the old procedure. Reject the null hypothesis and the mean daily yield for the new process is not less than that of the old procedure. Do not reject the null hypothesis and the mean daily yield for the new process is less than that of the old procedure. Do not reject the null hypothesis and the mean daily yield for the new process is not less than that of the old procedure.arrow_forwardVehicle speeds at a certain highway location are believed to have approximately a normal distribution with mean µ = 50 mph and standard deviation σ = 5 mph. The speeds for a randomly selected sample of n = 25 vehicles will be recorded. (a) Give numerical values for the mean and standard deviation of the sampling distribution of possible sample means for randomly selected samples of n = 25 from the population of vehicle speeds. Mean = s.d.(x) = (b) Use the Empirical Rule to find values that fill in the blanks in the following sentence. For a random sample of n = 25 vehicles, there is about a 95% chance that the mean vehicle speed in the sample will be between and mph. (c) Sample speeds for a random sample of 25 vehicles are measured at this location, and the sample mean is 59 mph. Given the answer to part (b), explain whether this result is consistent with the belief that the mean speed at this location is μ = 50 mph. A sample mean of 59 mph (when n = 25) --Select--- be consistent with…arrow_forward
arrow_back_ios
arrow_forward_ios
Recommended textbooks for you
- MATLAB: An Introduction with ApplicationsStatisticsISBN:9781119256830Author:Amos GilatPublisher:John Wiley & Sons Inc
 Probability and Statistics for Engineering and th...StatisticsISBN:9781305251809Author:Jay L. DevorePublisher:Cengage Learning
 Statistics for The Behavioral Sciences (MindTap C...StatisticsISBN:9781305504912Author:Frederick J Gravetter, Larry B. WallnauPublisher:Cengage Learning
  Elementary Statistics: Picturing the World (7th E...StatisticsISBN:9780134683416Author:Ron Larson, Betsy FarberPublisher:PEARSON
 The Basic Practice of StatisticsStatisticsISBN:9781319042578Author:David S. Moore, William I. Notz, Michael A. FlignerPublisher:W. H. Freeman
 Introduction to the Practice of StatisticsStatisticsISBN:9781319013387Author:David S. Moore, George P. McCabe, Bruce A. CraigPublisher:W. H. Freeman
MATLAB: An Introduction with Applications
Statistics
ISBN:9781119256830
Author:Amos Gilat
Publisher:John Wiley & Sons Inc
Probability and Statistics for Engineering and th...
Statistics
ISBN:9781305251809
Author:Jay L. Devore
Publisher:Cengage Learning
Statistics for The Behavioral Sciences (MindTap C...
Statistics
ISBN:9781305504912
Author:Frederick J Gravetter, Larry B. Wallnau
Publisher:Cengage Learning
Elementary Statistics: Picturing the World (7th E...
Statistics
ISBN:9780134683416
Author:Ron Larson, Betsy Farber
Publisher:PEARSON
The Basic Practice of Statistics
Statistics
ISBN:9781319042578
Author:David S. Moore, William I. Notz, Michael A. Fligner
Publisher:W. H. Freeman
Introduction to the Practice of Statistics
Statistics
ISBN:9781319013387
Author:David S. Moore, George P. McCabe, Bruce A. Craig
Publisher:W. H. Freeman