
A First Course in Probability (10th Edition)
10th Edition
ISBN: 9780134753119
Author: Sheldon Ross
Publisher: PEARSON
expand_more
expand_more
format_list_bulleted
Related questions
Question
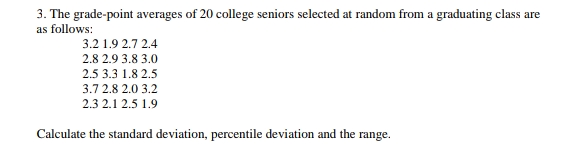

Transcribed Image Text:3. The grade-point averages of 20 college seniors selected at random from a graduating class are
as follows:
3.2 1.9 2.7 2.4
2.8 2.9 3.8 3.0
2.5 3.3 1.8 2.5
3.7 2.8 2.0 3.2
2.3 2.1 2.5 1.9
Calculate the standard deviation, percentile deviation and the range.
Expert Solution
This question has been solved!
Explore an expertly crafted, step-by-step solution for a thorough understanding of key concepts.

This is a popular solution

Trending nowThis is a popular solution!

Step by stepSolved in 3 steps

Knowledge Booster

Similar questions
- Of the data sets below, which has the largest standard deviation?Set A: 1, 2, 3, 4Set B: 1, 1, 4, 7Set C: 0, 5, 5, 10Set D: 6, 6, 6, 6 Set A Set B Set C Set Darrow_forwardI need the sample mean and sample standard deviation.arrow_forwardListed below are the amounts (dollars) it costs for marriage proposal packages at different baseball stadiums. Find the range, variance, and standard deviation for the given sample data. Include appropriate units in the results. Are there any outliers, and are they likely to have much of an effect on the measures of variation? 39 50 50 65 65 85 95 160 190 205 270 350 450 2000 3000 The range of the sample data is enter your response here ▼ dollars.dollars. marriages squared .marriages2. marriages.marriages. stadiums.stadiums. stadiums squared .stadiums2. dollars squared .dollars2. (Type an integer or a decimal. Do not round.) The standard deviation of the sample data is enter your response here ▼ marriages.marriages. marriages squared .marriages2. stadiums.stadiums. dollars squared .dollars2. stadiums squared .stadiums2. dollars.dollars. (Round to one decimal place as needed.) The variance of the…arrow_forward
- find the actual percentage in the data set, sort the DRIVE variable and count how many of the data points are less than 25 out of the total 35 data points. That is the actual percentage. How does this compare with your prediction? Mean: 57.457 Standard deviation: 26.539 Predicted percentage: 0.110 Drive: 44 20 88 6 71 42 76 63 61 63 84 28 55 33 88 80 86 83 5 85 25 25 54 54 81 73 29 76 78 77 42 65 71 94 6arrow_forwardGiven Samples A and B below, Sample A: 4.9 4.6 4.8 2.7 4.2 2.0 2.1 3.1 5.0 Sample B: 3.2 2.4 3.8 4.2 4.9 5.0 3.6 4.4 2.3 a. Calculate the mean and standard deviation for each sample. Sample A: X A = 0.00; s A = 0.00 Sample B: x B= 0.00 ; s B = 0.00 Round to two decimal places if necessary b. Calculate the coefficient of variation for each sample. Sample A: CV A = 0.00% Sample B: CV B = 0.00% Round to two decimal places if necessary c. Which sample is more variable? Sample A Sample B Neither sample is more variable than the otherarrow_forwardUse the magnitudes (Richter scale) of the 120 earthquakes listed in the accompanying data table. Use technology to find the range, variance, and standard deviation. If another value, 8.00, is added to those listed in the data set, do the measures of variation change much? 3.30 2.77 2.80 1.96 1.69 2.54 2.43 3.44 3.92 1.58 2.87 1.63 2.56 3.95 2.50 2.44 1.82 2.19 2.44 2.99 2.92 2.35 1.98 3.06 2.78 3.86 2.95 2.07 1.86 2.36 2.37 3.46 3.45 1.54 2.54 1.49 2.22 3.06 2.27 3.20 1.96 1.91 2.40 2.95 2.61 1.49 2.16 2.33 1.91 2.70 2.92 1.80 3.66 2.69 1.43 3.60 3.13 2.56 1.54 1.41 2.83 2.85 2.20 1.68 3.18 1.38 1.73 2.37 1.15 2.35 2.46 1.81 2.01 3.00 1.94 2.42 1.85 2.24 2.35 3.22 3.97 2.10 1.48 2.31 2.31 2.62 2.55 2.20 2.77 2.46 2.69 3.57 2.84 2.75 3.26 1.74 4.72 3.23 2.36 2.00 3.83 2.41 2.88 2.67 2.32 2.80 2.80 2.40 3.41 2.34 1.49 2.41 2.45 2.50 2.73 2.44 2.78 2.65 2.68 2.43 Without the extra data value, the range is 3.573.57. (Type an integer or…arrow_forward
- Find the sample standard deviation, coefficient of variation, and range. (Round your standard deviation to four decimal places and your coefficient of variation to two decimal places.) Given the following: 1.9, 2.4, 5.7, 4.5, 1.9, 8.5, 3.9, s CV % rangearrow_forwardThe ages of undergraduate students at two universities (one in the east and one in the west) are being compared. Researchers want to know if there is a difference in the mean age of students at the two universities. The population standard deviations are known. The following data shows the results of samples collected at each institution: School Location n (sample size) sample mean ( ) population standard deviation West 33 25.78 6.29 East 35 23.16 7.52 What is the value of the test statistic for the previous problem? (Enter your answer as a positive value even if you calculated a negative test statistic value i.e. if you calculated -1.311 you should enter 1.311). Round your answer to 3 decimal places.arrow_forwardFind the mean, median, standard deviation, and variance of the sample data. Also, from the original data set, find the values of the range and sample size. Identify the modal class (the one with the highest frequency). The statistics should be rounded properly- to the nearest hundredtharrow_forward
arrow_back_ios
arrow_forward_ios
Recommended textbooks for you
- A First Course in Probability (10th Edition)ProbabilityISBN:9780134753119Author:Sheldon RossPublisher:PEARSON

A First Course in Probability (10th Edition)
Probability
ISBN:9780134753119
Author:Sheldon Ross
Publisher:PEARSON