MATLAB: An Introduction with Applications
6th Edition
ISBN: 9781119256830
Author: Amos Gilat
Publisher: John Wiley & Sons Inc
expand_more
expand_more
format_list_bulleted
Question
Statistics: Measure of Dispersion

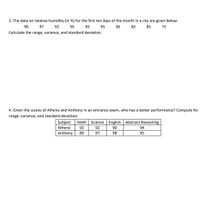
Transcribed Image Text:3. The data on relative humidity (in %) for the first ten days of the month in a city are given below:
90
97
92
95
93
95
85
83
85
75
Calculate the range, variance, and standard deviation.
4. Given the scores of Athena and Anthony in an entrance exam, who has a better performance? Compute for
range, variance, and standard deviation.
Subject
Math
Science English Abstract Reasoning
Athena
93
92
90
94
Anthony
89
97
98
95
Expert Solution
This question has been solved!
Explore an expertly crafted, step-by-step solution for a thorough understanding of key concepts.
This is a popular solution
Trending nowThis is a popular solution!
Step by stepSolved in 3 steps

Knowledge Booster
Learn more about
Need a deep-dive on the concept behind this application? Look no further. Learn more about this topic, statistics and related others by exploring similar questions and additional content below.Similar questions
- Doctors are testing a new antidepressant. A group of patients, all with similar characteristics, take part in the study. Some of the patients receive the new drug, while others receive the traditional drug. During the study, a number of patients complain about insomnia. The data are shown in the contingency table below. What is the relative risk of insomnia for those who receive the new drug? Round to two decimal places. New drug Total Insomnia No insomnia Total Traditional drug 36 Provide your answer below: 52 88 226 295 521 278 331 609arrow_forwardPlease fill in the blanksarrow_forwardThe Histogram shows the numberarrow_forward
- Owners of Major League Baseball teams have been concerned with attendance in recent years as declines have been noticed across the board. There are a variety of factors that are causing this decline, but it is believed that a team's win-loss record, payroll, stadium age, and home run ability help to drive attendance. space What was the average attendance per team in 2018? Round your answer to 3 decimal places. SPACE What team had the highest and lowest total attendance in 2018? Enter the team names along with their attendance figures as they appear in the data file. Round your attendance numbers to 3 decimal places. SPACE Team Attendance Highest attendance mil Lowest attendance mil space What was the range of attendance in 2018? Round your answer to 3 decimal places.arrow_forwardRanking in a class graduation is what kind of measurement?arrow_forwardPlease do not give solution in image format thankuarrow_forward
- Cumulative # of Relative Frequency Relative Courses Frequency Frequency 30 0.6 15 3) Find the relative frequency for students taking 3 courses. 1. 2.arrow_forwards Activity-Chapter 3 Math 2600 2. The data below shows the percent vaccinated (for the flu) by age group (6 months to 17 years, 18 to 49 years of age, 50 - 64 years of age, and 65 years of age or older) in the United States for last year up to Feb. 2018. Answer the questions below. Reference: https://www.cdc.gov/nchs/fastats/flu.htm Vaccinated Identify the who. People vaccinated for flu, b. Which age group has the greater a. 09 percentage of those who got a flu vaccine? 65 and older. 50+ C. Which age group has the lowest 45.2 percentage of those who got a flu vaccine? 18-49yr age group 31.8 d. Approximately 48.1 million Americans are 65 years old or older. According to this value, how many 65 and older Americans actually got the flu vaccine during this time 301 201 period? Just because the 65 and older category had the greater percentage, does that also mean the 65 and older group has the most 6 mos to 17 yrs 18 to 49 yrs 50 64 yrs 65 and older Age Group people getting vaccinated?…arrow_forwardPlease circle answerarrow_forward
arrow_back_ios
arrow_forward_ios
Recommended textbooks for you
 MATLAB: An Introduction with ApplicationsStatisticsISBN:9781119256830Author:Amos GilatPublisher:John Wiley & Sons Inc
 Probability and Statistics for Engineering and th...StatisticsISBN:9781305251809Author:Jay L. DevorePublisher:Cengage Learning
 Statistics for The Behavioral Sciences (MindTap C...StatisticsISBN:9781305504912Author:Frederick J Gravetter, Larry B. WallnauPublisher:Cengage Learning
 Elementary Statistics: Picturing the World (7th E...StatisticsISBN:9780134683416Author:Ron Larson, Betsy FarberPublisher:PEARSON
 The Basic Practice of StatisticsStatisticsISBN:9781319042578Author:David S. Moore, William I. Notz, Michael A. FlignerPublisher:W. H. Freeman
 Introduction to the Practice of StatisticsStatisticsISBN:9781319013387Author:David S. Moore, George P. McCabe, Bruce A. CraigPublisher:W. H. Freeman

MATLAB: An Introduction with Applications
Statistics
ISBN:9781119256830
Author:Amos Gilat
Publisher:John Wiley & Sons Inc

Probability and Statistics for Engineering and th...
Statistics
ISBN:9781305251809
Author:Jay L. Devore
Publisher:Cengage Learning

Statistics for The Behavioral Sciences (MindTap C...
Statistics
ISBN:9781305504912
Author:Frederick J Gravetter, Larry B. Wallnau
Publisher:Cengage Learning

Elementary Statistics: Picturing the World (7th E...
Statistics
ISBN:9780134683416
Author:Ron Larson, Betsy Farber
Publisher:PEARSON

The Basic Practice of Statistics
Statistics
ISBN:9781319042578
Author:David S. Moore, William I. Notz, Michael A. Fligner
Publisher:W. H. Freeman

Introduction to the Practice of Statistics
Statistics
ISBN:9781319013387
Author:David S. Moore, George P. McCabe, Bruce A. Craig
Publisher:W. H. Freeman