ENGR.ECONOMIC ANALYSIS
14th Edition
ISBN: 9780190931919
Author: NEWNAN
Publisher: Oxford University Press
expand_more
expand_more
format_list_bulleted
Question
Only 3.

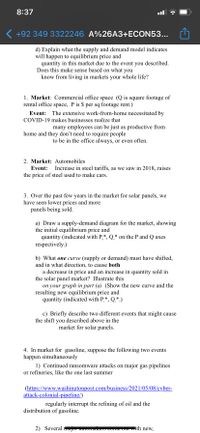
Transcribed Image Text:8:37
( +92 349 3322246 A%26A3+ECON53...
d) Explain what the supply and demand model indicates
will happen to equilibrium price and
quantity in this market due to the event you described.
Does this make sense based on what you
know from living in markets your whole life?
1. Market: Commercial office space (Q is square footage of
rental office space, P is $ per sq footage rent.)
Event: The extensive work-from-home necessitated by
COVID-19 makes businesses realize that
many employees can be just as productive from
home and they don't need to require people
to be in the office always, or even often.
2. Market: Automobiles
Event:
Increase in steel tariffs, as we saw in 2018, raises
the price of steel used to make cars.
3. Over the past few years in the market for solar panels, we
have seen lower prices and more
panels being sold.
a) Draw a supply-demand diagram for the market, showing
the initial equilibrium price and
quantity (indicated with P,*, Q* on the P and Q axes
respectively.)
b) What one curve (supply or demand) must have shifted,
and in what direction, to cause both
a decrease in price and an increase in quantity sold in
the solar panel market? Illustrate this
on your graph in part (a) (Show the new curve and the
resulting new equilibrium price and
quantity (indicated with P,*, Q,*.)
c) Briefly describe two different events that might cause
the shift you described above in the
market for solar panels.
4. In market for gasoline, suppose the following two events
happen simultaneously
1) Continued ransomware attacks on major gas pipelines
or refineries, like the one last summer
(https://www.washingtonpost.com/business/2021/05/08/cyber-
attack-colonial-pipeline/)
regularly interrupt the refining of oil and the
distribution of gasoline.
2) Several mujor uuwm
Come Outwith neW.
Expert Solution
arrow_forward
Step 1
Answer #3
The market supply curve of a commodity can shift as a result of a change in technology, input costs, government regulations, taxes and subsidies or with changes in weather conditions for agricultural products.
Trending nowThis is a popular solution!
Step by stepSolved in 2 steps with 2 images

Knowledge Booster
Similar questions
- The owner of a skating rink rents the rink for parties at $1200 if 60 or fewer skaters attend, so that the cost per person is $20 if 60 attend. For each 5 skaters above 60, she reduces the price per skater by $0.50. (a) Construct a table that gives the revenue generated if 60, 70, and 80 skaters attend. No. of skaters Total Revenue 60 70 80 Price per Skater $ $ $ (b) Does the owner's revenue from the rental of the rink increase or decrease as the number of skaters increases from 60 to 80? O The revenue increases. O The revenue decreases. (c) Write the equation that describes the revenue for parties with x groups of five skaters more than 60 skaters. R(x) = (d) Find the number of skaters that will maximize the revenue. skaters (e) Find the maximum revenue. $ (f) When the revenue is at the maximum possible, what price is paid per skater? $arrow_forwardPlz solve all parts Asap, i vll give positive feedback and upvote as well.arrow_forwardOnly parts d and e pleasearrow_forward
arrow_back_ios
arrow_forward_ios
Recommended textbooks for you

 Principles of Economics (12th Edition)EconomicsISBN:9780134078779Author:Karl E. Case, Ray C. Fair, Sharon E. OsterPublisher:PEARSON
 Engineering Economy (17th Edition)EconomicsISBN:9780134870069Author:William G. Sullivan, Elin M. Wicks, C. Patrick KoellingPublisher:PEARSON
 Principles of Economics (MindTap Course List)EconomicsISBN:9781305585126Author:N. Gregory MankiwPublisher:Cengage Learning
 Managerial Economics: A Problem Solving ApproachEconomicsISBN:9781337106665Author:Luke M. Froeb, Brian T. McCann, Michael R. Ward, Mike ShorPublisher:Cengage Learning
 Managerial Economics & Business Strategy (Mcgraw-...EconomicsISBN:9781259290619Author:Michael Baye, Jeff PrincePublisher:McGraw-Hill Education


Principles of Economics (12th Edition)
Economics
ISBN:9780134078779
Author:Karl E. Case, Ray C. Fair, Sharon E. Oster
Publisher:PEARSON

Engineering Economy (17th Edition)
Economics
ISBN:9780134870069
Author:William G. Sullivan, Elin M. Wicks, C. Patrick Koelling
Publisher:PEARSON

Principles of Economics (MindTap Course List)
Economics
ISBN:9781305585126
Author:N. Gregory Mankiw
Publisher:Cengage Learning

Managerial Economics: A Problem Solving Approach
Economics
ISBN:9781337106665
Author:Luke M. Froeb, Brian T. McCann, Michael R. Ward, Mike Shor
Publisher:Cengage Learning

Managerial Economics & Business Strategy (Mcgraw-...
Economics
ISBN:9781259290619
Author:Michael Baye, Jeff Prince
Publisher:McGraw-Hill Education