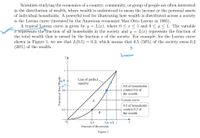
Q: May I know, education level have positive relationships with income level right? What about primary…
A: Yes, the education level has a positive relationship with the level of income and both are…
Q: In an economy, over the last decade, each of the top five decile groups has experienced a fall in…
A: Given Information : The top five decile group of an economy faces a decrease in the total share of…
Q: Which of the following is included in personalincome but not in national income?a. Compensation for…
A: Personal Income and National Income varies certainly. National Income includes all the factor…
Q: Question 22
A: In national accounting, an economy's GDP is estimated by adding all final commodities' values that…
Q: The combination of low GDP per capita and high income inequality is sometimes positive for companies…
A: Agricultural products include vegetables, oils, fruits, milk, meat, eggs, and cereals.
Q: The measurement of GDP calculates the value of intermediate goods which is already included in the…
A: Final goods are goods that do not need any further processing. Final goods are produced for the…
Q: Can you explain the way how to measure the income in-equality in the Philippines?
A: The unequal distribution of income among a population is known as income inequality. Income…
Q: 6. Fill in the bottom table by converting nominal incomes into real incomes. Nominal Mean Household…
A: We will use the following formula to calculate real incomes for each 3 category. Real income =…
Q: Choose the economic indicators below that do not cause higher income inequality but do correlate…
A: The value of final services and goods produced in a country at a particular time is known as…
Q: The bench market for the income level necessary to maintain a basic standard of living is based on…
A: There is a tendency for individuals below the poverty line to remain there due to the structure of…
Q: 17. Wealth and income are two different things. Explain the difference between them. Then, explain…
A: Wealth refers to the total value of net assets owned by individual. It also comprises overall value…
Q: Data on the distribution of income for the United States show that from 1970 through 2014, the share…
A: The distribution of income refers to how a country's total economic output (GDP) is divided amongst…
Q: Explain the importance of GDP
A: useful info Hello. Since you have posted multiple questions and not specified which question needs…
Q: Using the following information provided in the table below, calculate the Gini-coefficient for…
A: find below the answer.
Q: Calculate the new Gini Coefficient for Algura when income changes as follows: Population 10 32…
A: find the answer below.
Q: 2010 Price Quantity 100 2016 Price QuantitY 113 55 85 10 se.24 50.32 0.29 0.34 1.04 0.64 0.43 50…
A: a) The simple price index formula is given by = Pcurrent/Pbase *100 Thus, Fruit Price Index…
Q: 10. The distribution of income is correlated with the distribution of human capital. A) True B)…
A: Human capital alludes to the aggregate abilities, knowledge, experience, and capacities moved by…
Q: Why is real GNP/GNI per capita considered a better measure of Irish living standards in recent…
A: The degree of wealth, comfort, material things, and requirements accessible to a certain social…
Q: 1. Explain why a Country with low GDP is considered poor.
A: Since you have asked multiple question, we will solve the first question for you. If you want any…
Q: 14. In which form, the largest percentage of national income is earned? A. O Interest income B. O…
A: National Income is the aggregate earning of country's production in the current year which includes…
Q: True or false: An increase in the share of income earned by the top half of the income distribution…
A: Suppose that initially there are 100 people in the economy and their income distribution is given…
Q: Briefly describe any four census-related deficiencies as sources of geographical data
A: Types of Census Information Most censuses collect information on: Individual residents aged 0…
Q: The quintile distribution of per capita income for 2012 and 2014 are as follows: Quintile Shares 2 3…
A: 2) b) The quintiles show the distribution of per capita income based on 20% brackets i.e. the first…
Q: GDP per capita is an indicator that tells us the whole picture about income inequality and income…
A: GDP is the value of final goods and services produced in the economy within a given period of time.
Q: What do you mean by the F-Statistic? Explain The F-statistic with q = 2 restriction & The…
A: The F-statistic is the statistic of the F-test. It indicates the ratio of two variances. The…
Q: Create the within differenced log wage and education variables for both twins, and denote the…
A: Introduction:- where wages are calculated on a regular basis This is a wage relapse model with many…
Q: Discuss the idea of vicious circle of poverty of your chosen country.
A: Hello, thank you for the question. Since there are multiple questions posted here, only the first…
Q: Which of the following is studied under the theory of Macroeconomics? a. Business income b.…
A: As wants and desires of the individuals in the economy are unlimited but the resources available to…
Q: The residents of Vegopia spend all of their income on cauliflower,broccoli ,and carrots.In 2016,they…
A: Price per unit is defined as the ratio of the total cost to quantity. It means that as total cost…
Q: In the United States, which factor of production earns the largest share of the nation's total…
A: In the context of the global economy, labor mobility empowers individuals to seek improved…
Q: In the above diagrams for a hypothetical economy, Figure 2 shows the: 40 30 Wages and sa aries 20…
A: The income distribution shows how the national income is divided between the economic agent in the…
Q: Pls answer in simple words : Are extremes of wealth and poverty desirable ?
A: In an economy, extremes of wealth implies a situation that shows the maximum value of income and the…
Q: A10. What is “relative inequality” and how is it measured? How is relative inequality different to…
A: Relative inequality The disproportionality of income is referred to as relative income disparity.…
Q: 6. Official poverty thresholds measure poverty in households consisting of one, two, three, or four…
A: "Since you have asked multiple questions, we will solve the first one for you. If you want any…
Q: nges and Salaries. $1300 rsonal Income Taxes. 90 yroll Taxes (e.g. Social Security tax) 85 come…
A: 1. GDP using income approach is calculated using the formula = Total national income + Sales taxes…
Q: What do we mean by market income? Example
A: Financial economics refers to the branch of economics that analyzes the use and distribution of…
Q: Which of these is a possible cause of the value of the Gini coefficient increasing from 30 to 35? a.…
A: The Gini coefficient is an economic indicator that represents the income distribution in the…
Q: Percentage of income a Percentage of Households From the graph above, we can say that the bottom 60%…
A: Lorenz Curve is the upward-sloping curve that pictures the income or wealth inequality in any…
Q: 23.Giving reason, explain how should the following be treated in the estimation of National Income )…
A: As per the given question- 1) Payment of bonus by a firm is not treated or not included in the…
Q: The populations of Abu Dhabi (National, Non-National, and Total) and UAE are shown in the following…
A: Here we are given the population data of Abu Dhabi & UAE and we will use this data to calculate…
Q: 5) percent of U.S. Latinos trace their heritage to Mexico. Provide at least two reasons why Mexico…
A: INTERNAL CULTURE HAS AN IMPORTANT IMPACT ON AMERICAN FOOD, MUSIC, SPORTS, BEAUTY PRODUCTS, FASHION,…
Trending now
This is a popular solution!
Step by step
Solved in 2 steps
- Economics Allocation of Possible Income You are given different amounts of money on which to live (roughly approximating different Malaysian income groups). You are required to allocate funds to the categories of housing, food, clothing, education, health, transportation, recreation, etc. – other categories may be added by you. Different income groups are asked to critique the allocation of different groups - is it reasonable, why do you say so and how could it be allocated better. T20 income RM15,000 M40 income RM8,000 B40 income RM3000The table shows the distribution of personal income in the United States in 2016. Percentage of total income Households Poorest 20 percent 3.1 Second 20 percent Third 20 percent Fourth 20 percent Richest 20 percent 8.2 14.3 23.2 51.2 For all U.S. households to receive an equal share of income, what percentage of total income would the poorest 20 percent of households have to receive from higher-income groups? What percentage would the second poorest have to receive? >>> Answer to 1 decimal place. The poorest 20 percent of households would have to receive percent. The second poorest 20 percent of households have to receive percent.What is the formula of the per capita income given example of it please?
- Prosecutors representing the Securities and Exchange Commission recently announced criminal charges against 13 individuals for engaging in insider trading. According to the SEC’s director of enforcement, a trading ring acting on inside information “compromises the markets’ integrity and investors’ trust.” Explain why.Personal income PI is Select one: a. All income received by households b. All income earned by households minus personal taxes c. All income received by households minus personal taxes d. None of the answers are correct e. All income earned by householdsConsider the following table that describes how everyone living in medieval England was classified. Total Population in Medieval England 25,000 # of merchants (selling clothing, jewelry, perfume, shoes, misc. items) # of people currently without work, but seeking employment # of students enrolled full-time in university 1,250 800 700 # of people working in the ale, wine and beer industry 1,200 # of people in building (blacksmiths, stone cutters, wood carvers, builders) 3,500 # of scholars and teachers 2500 # serving out prison sentences in the dungeons 1,500 # of wives raising children and running their own households # of servants working for royalty or aristocrats # of children enrolled in schools 600 3,000 900 # of people in the agricultural/livestock industry (ranchers, stable boys) 2,750 # serving as soldiers to defend the country 1,000 # of people not seeking work (members of the aristocracy) # of people in the food/drink industry (cooks, butchers) # of patients living in mental…
- Answer the question belowWhat are categories of population: (Select what applies) Select one or more: a. Labor Force b. Unemployed c. Not in the labor force d. EmployedWhich statement is true? The fewest number of people in the United States are in the middle class. O The least number of people in the United States are in the working class. O The greatest number of people in the United States are in the working class. The largest number of people in the United States are in the middle class.
- 7. Which of the following interventions will address the concern on poverty and unequal distribution of income? a. Free Tuition and Matriculation in all levels. b. Free and accessible health services for all. c. Free housing for the urban poor. d. All of the above.Suppose the make believe economy of Tinto produces and consumes 2 goods: clothing and food. The following table shows the quantities produced and consumed, as well as nominal prices. For clarity, they produce 100 clothing per week and 400 food per week. They claim that they consume 50 clothing per week and 450 food per week. Produced Consumed Price Clothing100 (clothing/week)50 (clothing/week)8 ($/clothing) Food 400 (food/week) 450 (food/week) 4 ($/food) a) What do they export and what they import? How can you tell? Explain clearly and concisely. b) Using information in the table, show why it is not possible for Tinto to consume 50 clothing per week and 450 food per week. (Hint: real price)Distribution of Income in Percentage of the United States Households 1985 2020 3.0 8.1 14.0 22.6 52.2 Lowest 20% Second 20% Third 20% Fourth 20% Highest 20% 4.0 9.7 16.3 24.0 46.6 Which statement best describes the Multiple Choice in the table? Between 1985 and 2020, the lowest and the highest quintiles gained larger shares of total income at the expense of the three middle quintiles. Between 1985 and 2020, each quintile gained a larger share of total income because the level of total income increased greatly. Between 1985 and 2020, the highest 20 percent of households gained a larger share of total income at the expense of the lowest 80 percent. Between 1985 and 2020, the lowest 40 percent of households gained a larger share of total income at the expense of the highest 40 percent.