
MATLAB: An Introduction with Applications
6th Edition
ISBN: 9781119256830
Author: Amos Gilat
Publisher: John Wiley & Sons Inc
expand_more
expand_more
format_list_bulleted
Related questions
Question
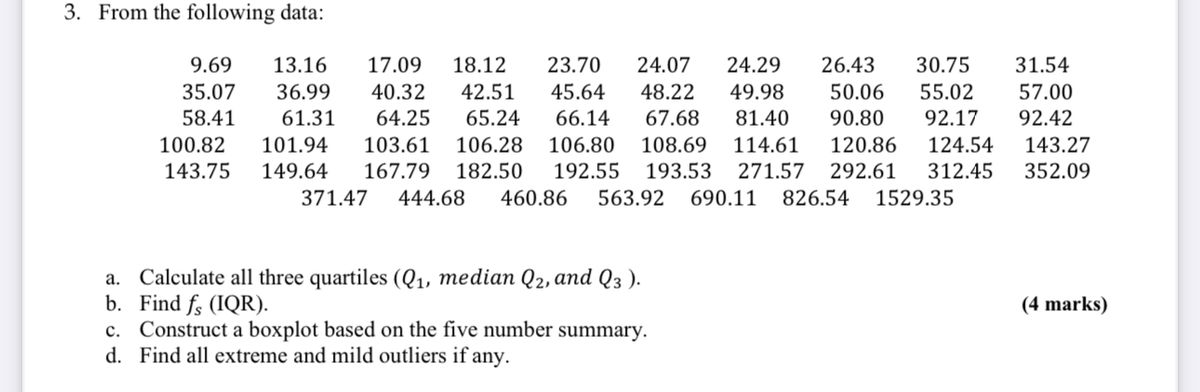

Transcribed Image Text:3. From the following data:
9.69 13.16 17.09 18.12 23.70 24.07 24.29 26.43 30.75 31.54
35.07 36.99 40.32 42.51 45.64 48.22 49.98 50.06 55.02 57.00
58.41 61.31 64.25 65.24 66.14 67.68 81.40 90.80 92.17 92.42
100.82 101.94 103.61 106.28 106.80 108.69 114.61 120.86 124.54 143.27
143.75 149.64 167.79 182.50 192.55 193.53 271.57 292.61 312.45 352.09
371.47 444.68 460.86 563.92 690.11 826.54 1529.35
a.
Calculate all three quartiles (Q₁, median Q2, and Q3 ).
b. Find fo (IQR).
c. Construct a boxplot based on the five number summary.
d. Find all extreme and mild outliers if any.
(4 marks)
SAVE
AI-Generated Solution
info
AI-generated content may present inaccurate or offensive content that does not represent bartleby’s views.
Unlock instant AI solutions
Tap the button
to generate a solution
to generate a solution
Click the button to generate
a solution
a solution
Knowledge Booster

Similar questions
- Average Water Temp Manatee Deaths 72.0 35 71.9 38 71.7 42 71.7 49 71.6 53 71.5 54 71.4 60 71.0 67 71.2 68 71.2 69 71.1 73 71.0 73 70.9 73 70.9 78 70.8 79 70.7 81 70.6 81 70.6 82 70.5 83 70.5 88 70.4 90 69.9 92 69.8 95 69.5 97 A researcher is interested to see if there is an association between average water temperature and manatee deaths in sub-tropical regions, and decides to test for linear correlation at the 0.01 significance level. The researcher takes a random sample of subtropical regions and measures their number of manatee deaths and average water temperature. The table above gives the paired data for 24 randomly selected subtropical regions. Do a scatterplot of average water temperature and manatee deaths for this random sample of sub-tropical regions and report your impression of whether or not there seems to…arrow_forwardHere is a data set (n=117n=117) that has been sorted. 4.4 14.2 14.5 15.3 17.2 18.1 18.2 18.3 19.3 19.6 19.7 19.8 20.1 21.1 21.6 22.1 22.5 22.5 22.7 23 23.6 23.6 24.1 24.3 24.5 24.7 24.8 25 25.4 25.5 25.6 25.7 25.9 26 26 26.1 26.6 26.8 27.2 27.6 27.6 27.6 27.7 27.7 27.7 28.3 28.3 28.4 28.4 28.6 28.6 28.8 29 29 29.1 29.6 30 30 30.1 30.2 30.3 30.4 30.6 30.7 31 31.1 31.2 31.3 31.4 31.4 31.7 32 32.3 32.5 32.9 32.9 33.4 33.5 33.7 33.8 33.9 34.3 34.8 35 35.2 35.2 35.3 35.8 35.8 35.9 35.9 36 36.1 36.8 36.9 37.4 37.9 38.3 38.4 38.7 39.5 40.2 40.2 40.4 40.4 40.5 41.1 41.8 42 42 42.2 42.8 43.2 43.7 46.5 48.1 49.9 To find P30, what is the value of the locator (L)?L=L= Use the locator, give the value for the 30-Percentile:P30 = Thank you.arrow_forwardC. The following data represent the average monthly temperatures for Washington, D.C. Month, x Average Monthly Temperature, °F 34.6 37.5 47.2 56.5 66.4 75.6 80.0 78.5 71.3 59.7 49.8 39.4 January, 1 February, 2 March, 3 April, 4 May, 5 June, 6 July, 7 August, 8 September, 9 October, 10 November, 11 December, 12 1) What is the regression equation for the average temperature in Washington, D.C.? 2) Find the predicted value for March of the following year.arrow_forward
- 39.5 44.3 48.5 51.7 59.6 62.8 66.9 71 45.6 46.7 57 46.4 68.2 36.4 54.6 64.4 60.4 51.7 54.8 63.3 58.1 59.2 68.2 56.6 38.6 40 57.4 53.4 54.4 48.3 60.9 46.4 47.4 40 44.7 49.6 59.2 48 65.7 60.1 40 54 52.6 70 53.2 65.7 55.4 60.1 52.8 53 47 46 57.9 48.5 49.1 55.4 63 60.9 51.3 52.8 48 48 71.4 44.3 56.2 47.4 55 44.3 55 46 Report the mean using the rounding rules suggested in the book.mean = median =arrow_forwardA movie studio wishes to determine the relationship between the revenue from rental of DVDS and videotapes of comedies and the revenue generated from the theatrical release of such movies. The studio has the following bivariate data from a sample of fifteen comedies released over the past five years. These data give the revenue x from theatrical release (in millions of dollars) and the revenue y from DVD and videotape rentals (in millions of dollars) for each of the fifteen movies. The data are displayed in the Figure 1 scatter plot. Also given is the product of the theater revenue and the rental revenue for each of the fifteen movies. (These products, written in the column labelled "xy", may aid in calculations.) Theater Rental revenue, x revenue, y ху (in millions of dollars) (in millions of dollars) 14.1 2.6 36.66 25.8 6.7 172.86 18- 7.0 2.6 18.2 16- 27.7 11.7 324.09 14+ 12+ 31.4 5.3 166.42 10+ 49.3 14.9 734.57 36.2 12.5 452.5 20.5 4.7 96.35 65.9 9.3 612.87 60.2 15.7 945.14 10 20 30…arrow_forwardThe following data values are per capita expenditures on public libraries for each of the 50 states. 29.48 24.45 23.64 23.34 22.10 21.16 19.83 18.01 17.95 17.23 16.53 16.29 15.89 15.85 13.64 13.37 13.16 13.09 12.66 12.37 11.93 10.99 10.55 10.24 10.06 9.84 9.65 8.94 7.70 7.56 7.46 7.04 6.58 5.98 19.81 19.25 19.18 18.62 14.74 14.53 14.46 13.83 11.85 11.71 11.53 11.34 8.72 8.22 8.13 8.01 Use a histogram starting at 5 and using a class width of 5 to find the approximate values of the percentiles. (Round the answers to one decimal place.) 50th 70th 20th 90th 40tharrow_forward
- x y 28.2 -1200.2 40.9 -756.8 26.2 869.2 43.7 749.2 12.1 -636.4 22.2 -83.4 7.1 112.5 0.4 521.4 46.8 96.6 33 1011.2 5.4 -1316.2 17.1 606.4 46.2 517.3 40.6 -128.3 186 -8298.4 Use your graphing calculator to determine the correlation coefficient for this data set. Round your answer to the nearest thousandth.r=r=arrow_forwardA statistics instructor asks each student in his classes to report how much the student spent on textbooks for the semester. The figures reported by students are shown below. 725 735 555 420 385 480 505 270 405 285 585 450 515 560 500 395 545 595 365 455 505 345 555 485 560 475 520 455 355 590 550 495 505 505 495 465 370 355 480 385 515 605 480 410 485 560 475 350 465 435 455 380 320 535 565 520 510 495 485 650 490 295 555 540 565 490 570 380 610 600 390 375 390 335 525 445 540 490 485 555 440 560 405 590 520 470 560 510 340 385 585 635 415 455 590 385 505 510 545 405 470 560 495 515 495 595 565 615 470 680 465 470 310 470 505 465 375 360 650 460 560 500 375 500 370 415 490 440 470 525 535 640 385 475 425 595 505 365 485 495 390 380 585 690arrow_forwardFind P39 from the following data 5 10 11 16 23 27 33 35 37 42 44 46 50 53 54 55 68 69 73 74 76 77 79 81 86 93 95 100 P39 =arrow_forward
- 16.2 31.1 25.3 24.8 23.8 8.0 27.2 24.0 38.8 51.5 28.0 26.5 8.3 43.1 29.7 39.3 18.7 28.2 17.9 33.1 25.6 5.4 39.4 29.2 41.1 15.8 24.3 32.0 25.8 52.4 17.1 33.0 30.1 23.2 19.1 24.3 4.8 36.7 11.1 40.9 28.8 27.9 46.8 36.7 11.5 32.4 38.0 26.1 25.3 39.2 23.8 23.4 27.9 44.6 27.5 35.3 34.5 11.9 25.6 27.3 28.0 24.8 16.5 13.6 34.2 34.8 21.2 31.0 24.9 31.3 35.0 27.5 42.2 37.8 49.5 31.2 29.0 26.1 26.5 25.6 17.5 29.7 23.9 18.5 37.3 7.4 30.8 14.0 25.7 37.8 32.0 20.4 6.9 19.8 45.7 29.3 18.4 56.3 35.4 0.9 22.9 BMI data Obesity is a risk factor for many health problems s uch as type 2 diabetes, high blood pressure, joint problems, and gallstones. Using data collected in 2 018 through the National Health and Nutrition Examination Survey, the National Institute of Diabe tes and Digestive and Kidney Diseases estimates tha t 37.7% of all adults in the United States have a bod y mass index (BMI) in excess of 30 and so are categorized as obese. The data in the file Obesity (from the textbook but also…arrow_forwardHere is a data set (n = 117) that has been sorted. 58.1 62.6 62.9 64 64.5 64.6 64.6 66 67.6 67.8 68.4 68.4 68.4 69.3 69.3 69.5 69.7 69.9 70.9 70.9 71.7 72 72.5 72.8 73.5 73.6 73.6 73.7 73.8 73.9 74.2 74.2 74.2 74.6 74.7 74.9 74.9 75.3 75.4 75.6 75.9 76 76.2 76.2 76.4 77 77 77.2 77.3 77.8 78.3 78.5 78.6 78.6 78.7 78.8 78.8 78.8 78.9 79.4 79.8 79.9 80 80.4 80.6 80.8 80.9 81 81 81.5 81.5 81.6 81.8 81.9 82 82.4 82.9 83.1 83.4 83.6 83.7 83.7 84.1 84.1 84.5 84.6 84.7 84.8 85.4 85.4 85.8 86 86.2 86.3 86.3 86.4 86.5 86.8 86.8 86.8 87 87.4 87.7 87.8 88.3 88.4 88.4 88.7 89.8 90.5 91.5 92.7 92.9 93.5 95 96.7 109.8 Find the 78th-Percentile: P78 c0 00arrow_forward6.4.2 Using the data from Exercise 6.1.14 on swim times, a. Find the median and quartiles for the data. b. Make a box plot of the data. c. Repeat (a) and (b) for the data without the extreme outlier and comment. d. Compare the distribution of the data with and without the extreme outlier.arrow_forward
arrow_back_ios
SEE MORE QUESTIONS
arrow_forward_ios
Recommended textbooks for you
- MATLAB: An Introduction with ApplicationsStatisticsISBN:9781119256830Author:Amos GilatPublisher:John Wiley & Sons Inc
 Probability and Statistics for Engineering and th...StatisticsISBN:9781305251809Author:Jay L. DevorePublisher:Cengage Learning
 Statistics for The Behavioral Sciences (MindTap C...StatisticsISBN:9781305504912Author:Frederick J Gravetter, Larry B. WallnauPublisher:Cengage Learning
  Elementary Statistics: Picturing the World (7th E...StatisticsISBN:9780134683416Author:Ron Larson, Betsy FarberPublisher:PEARSON
 The Basic Practice of StatisticsStatisticsISBN:9781319042578Author:David S. Moore, William I. Notz, Michael A. FlignerPublisher:W. H. Freeman
 Introduction to the Practice of StatisticsStatisticsISBN:9781319013387Author:David S. Moore, George P. McCabe, Bruce A. CraigPublisher:W. H. Freeman
MATLAB: An Introduction with Applications
Statistics
ISBN:9781119256830
Author:Amos Gilat
Publisher:John Wiley & Sons Inc
Probability and Statistics for Engineering and th...
Statistics
ISBN:9781305251809
Author:Jay L. Devore
Publisher:Cengage Learning
Statistics for The Behavioral Sciences (MindTap C...
Statistics
ISBN:9781305504912
Author:Frederick J Gravetter, Larry B. Wallnau
Publisher:Cengage Learning
Elementary Statistics: Picturing the World (7th E...
Statistics
ISBN:9780134683416
Author:Ron Larson, Betsy Farber
Publisher:PEARSON
The Basic Practice of Statistics
Statistics
ISBN:9781319042578
Author:David S. Moore, William I. Notz, Michael A. Fligner
Publisher:W. H. Freeman
Introduction to the Practice of Statistics
Statistics
ISBN:9781319013387
Author:David S. Moore, George P. McCabe, Bruce A. Craig
Publisher:W. H. Freeman