
MATLAB: An Introduction with Applications
6th Edition
ISBN: 9781119256830
Author: Amos Gilat
Publisher: John Wiley & Sons Inc
expand_more
expand_more
format_list_bulleted
Related questions
Question
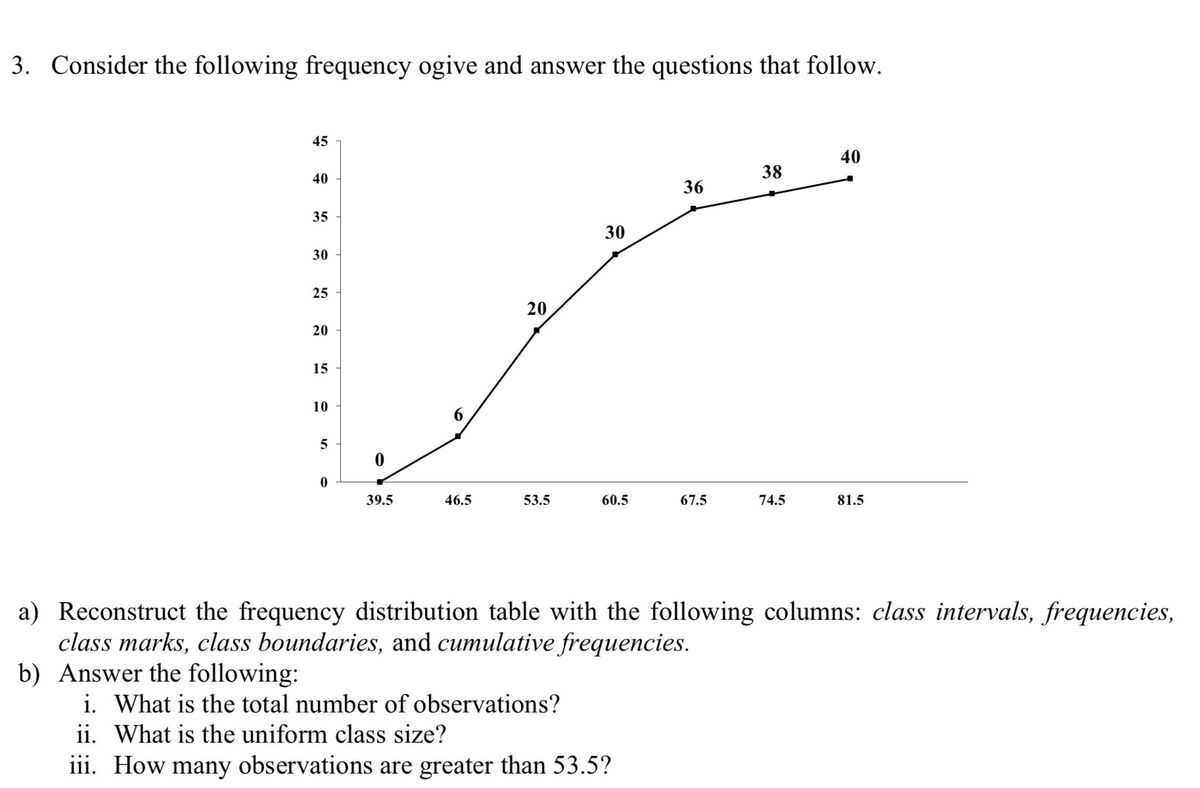

Transcribed Image Text:3. Consider the following frequency ogive and answer the questions that follow.
45
40
38
40
36
35
30
30
25
20
20
15
10
6.
39.5
46.5
53.5
60.5
67.5
74.5
81.5
a) Reconstruct the frequency distribution table with the following columns: class intervals, frequencies,
class marks, class boundaries, and cumulative frequencies.
b) Answer the following:
i. What is the total number of observations?
ii. What is the uniform class size?
iii. How many observations are greater than 53.5?
Expert Solution
This question has been solved!
Explore an expertly crafted, step-by-step solution for a thorough understanding of key concepts.

This is a popular solution

Trending nowThis is a popular solution!

Step by stepSolved in 3 steps

Knowledge Booster

Similar questions
- 1. What is the class width for a frequency distribution with 5 classes? 2. Find the class limits. 3. Find the class boundaries. 4. Find the frequencies.arrow_forwardThe following are a sample of ages of respondents to a survey. 20, 40, 45, 49, 50, 50, 51, 55, 60, 80 Answer the following questions. 1. What is the class width of the frequency distribution if you are to use 7 classes? 2. Form the frequency table. Class Limits 3. What are the outliers? OA. There are no outliers OB. 80 OC. 20 OD. 20 and 80 Frequencyarrow_forward1. Construct a frequency table for the data, including both the number and percentage in each category. Use intervals of 100, starting 170K 2. Construct a frequency histogram using the frequency table created in part A 3. What can you analyze about the data distribution?arrow_forward
- 3. Construct a Grouped Frequency Distribution on the data below 19 61 21 33 26 36 31 58 28 19 20 22 31 63 27 76 68 26 42 46 38 48 66 43 26 18 51 22 52 53 32 35 32 40 30 22 18 27 23 32 37 27 38 42 45 55 42 45 50 47arrow_forward3. Construct frequency distribution, with 6 classes. Also find class boundaries, mid points, relative frequency and cumulative frequency of each class. 65 91 85 76 85 87 79 93 82 75 100 70 88 83 59 87 69 89 54 74 89 80 94 67 77 92 82 70 94 84 96 98 46 70 90 96 88 72arrow_forwardConsider the following data and create a frequency table with 5 classes. Top 10 Provinces by Number of McDonald's Ontario.. Quebec.. Alberta...... British Columbia. Manitoba. Saskatchewan.... Nova Scotia.. New Brunswick........ Newfoundland and Labrador.... Prince Edward Island. a. What is the class width? b. Fill out the Frequency table Class Limits Lower Upper 490 302 192 182 ..55 42 39 35 19 .6 Class Boundaries Lower Upper Midpointarrow_forward
- The following are the grades received on an paper by 25 students. 97 97 98 40 45 77 65 65 65 68 81 93 68 71 87 85 88 76 79 78 87 81 81 83 89 a) Fill in the frequency table below using the data given. Use 10-point bins. Note: You may have rows left over. Grade Frequency Relative Frequency Cumulative Frequency Total: b) Draw a histogram based on the frequency table in part a . Don’t forget to label properly the axes, and put a title.arrow_forwarda) Construct a frequency distribution table. Take 20 as the lowest limit of the first class and 10 as the width of each class. b) Develop the relative frequency for the above data. c) Develop a cumulative frequency for the above data.arrow_forwardCreate a relative frequency distribution table for the following ungrouped data: 34 53 39 36 50 41 52 36 55 34 57 49 60 39 32 57 45 54 56 33 33 35 47 46 52 39 39 52 57 32. Create a histogram that corresponds to the created table.arrow_forward
- Create a frequency distribution from Question 1 on previous sheet using the following classes: 2-15, 16-29, 30-43, 44-57,58-71, 72-85, 86-99. Provide the frequency, relative frequency, cumulative frequency using these classes:arrow_forwardThirty students in the School of Business were asked what their majors were. The following represents their responses (M = Management; A = Accounting; E = Economics; O = Others). A M M A M M E M A E E M A E E E A M A A M а. Construct a frequency distribution. , b. Construct a bar chart Please upload a file containing all of your work and diagrams.arrow_forward
arrow_back_ios
arrow_forward_ios
Recommended textbooks for you
- MATLAB: An Introduction with ApplicationsStatisticsISBN:9781119256830Author:Amos GilatPublisher:John Wiley & Sons Inc
 Probability and Statistics for Engineering and th...StatisticsISBN:9781305251809Author:Jay L. DevorePublisher:Cengage Learning
 Statistics for The Behavioral Sciences (MindTap C...StatisticsISBN:9781305504912Author:Frederick J Gravetter, Larry B. WallnauPublisher:Cengage Learning
  Elementary Statistics: Picturing the World (7th E...StatisticsISBN:9780134683416Author:Ron Larson, Betsy FarberPublisher:PEARSON
 The Basic Practice of StatisticsStatisticsISBN:9781319042578Author:David S. Moore, William I. Notz, Michael A. FlignerPublisher:W. H. Freeman
 Introduction to the Practice of StatisticsStatisticsISBN:9781319013387Author:David S. Moore, George P. McCabe, Bruce A. CraigPublisher:W. H. Freeman
MATLAB: An Introduction with Applications
Statistics
ISBN:9781119256830
Author:Amos Gilat
Publisher:John Wiley & Sons Inc
Probability and Statistics for Engineering and th...
Statistics
ISBN:9781305251809
Author:Jay L. Devore
Publisher:Cengage Learning
Statistics for The Behavioral Sciences (MindTap C...
Statistics
ISBN:9781305504912
Author:Frederick J Gravetter, Larry B. Wallnau
Publisher:Cengage Learning
Elementary Statistics: Picturing the World (7th E...
Statistics
ISBN:9780134683416
Author:Ron Larson, Betsy Farber
Publisher:PEARSON
The Basic Practice of Statistics
Statistics
ISBN:9781319042578
Author:David S. Moore, William I. Notz, Michael A. Fligner
Publisher:W. H. Freeman
Introduction to the Practice of Statistics
Statistics
ISBN:9781319013387
Author:David S. Moore, George P. McCabe, Bruce A. Craig
Publisher:W. H. Freeman