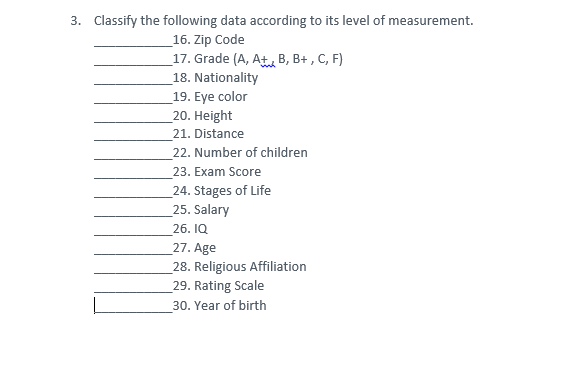
3. Classify the following data according to its level of measurement. _16. Zip Code _17. Grade (A, At B, B+ , C, F) _18. Nationality 19. Eye color 20. Height 21. Distance _22. Number of children 23. Exam Score _24. Stages of Life 25. Salary 26. IQ 27. Age _28. Religious Affiliation _29. Rating Scale 30. Year of birth


Q: It is assumed that a production process may produce some defective items. It is found that 12 items…
A: It is given that, the number of defectives out of 100 is 12.
Q: calculate the median and mean of the justice's years of service 2. what proportion of the justices…
A: The question is about to find descriptive Stats Given : To find : 1 ) Median and mean of years of…
Q: Estimate the following statistical measures 1. Mean 2. Median 3. Mode
A: The summary of the data using T1-83 calculator is given by: Press STAT. Select 01:EDIT. Press…
Q: In a sample of 30 students of the Academy, we obtained the following data which represents the…
A: Measure of Central tendency are Mean, Median and mode. The mean is the most frequently used and the…
Q: The following is a list of hospitals in Pasig City. We are interested in estimating the average…
A: Solution: As per the guidelines only first three parts should be answered. Please repost other parts…
Q: A summary measure that is computed to describe a characteristic of an entire population is called?
A: Statistic - To describe a characteristic of a sample Parameter - To describe a characteristic of…
Q: A psychology office at a certain college conducted a study on student risk, from that same…
A: The out of 25 students 2 have high risk, 10 have a low risk, 5 have medium risk, 1 have very high…
Q: Here are yesterday's high temperatures (in Fahrenheit) in 11 U.S. cities. 52, 56, 62, 64, 65, 66,…
A:
Q: A national company with several locations in the DFW area wants to provide on-site childcare for…
A: Given:- 107,92,97,95,105,101,91,99,95,104 sample size (n)=10 Formula:- mean x=∑x¯Px σx=∑x2Px-μx2
Q: Suppose you want to determine the mean number of cans of soda drunk each month by students in their…
A: Convenience sampling: The convenience sampling is taken by using the subjects that are easily…
Q: Conduct a test whether sex and age of stereo shop customers are independent @.05 level of…
A: The provided information is The observed frequency is Sex Age Male Female…
Q: The governor of Florida would like to estimate the mean age of all Florida residents. To do so, he…
A: Here we need to find which of the following describes the given value of the sample mean 58.2
Q: Calculate the 5 number summary of the given data. Using approximation method.…
A: Given that We have to find five number summary of the following data…
Q: A number resulting from the manipulation of raw data according to certain specified procedures is…
A: Parameter:Any statistical measure based on all units in the population or computable characteristic…
Q: find mean and standard deviation 12,13,15,16,17,19,22,23,25,28,30
A: Given data is 12,13,15,16,17,19,22,23,25,28,30 From these data we have to calculate mean and…
Q: 9, 19, 9, 15, 7, 14, 19, 8, 17 Mean Median Mode
A: Mean=sum of the data setnumber of data points =9+19+9+15+7+14+19+8+179 =1179…
Q: Suppose you want to determine the mean number of cans of soda drunk each month by students in their…
A: Hello! Thank You for the question. Answers will vary, One of the possible answers is given below:
Q: The governor of Florida would like to estimate the mean age of all Florida residents. To do so, he…
A: We have given that he randomly selects 500 Florida residents and determines their mean age to be…
Q: the tampa bay (florida) area chamber of commerce wanted to know wheither the mean weekly salary of…
A: Given that: School teacher sample data: 1095 1075 1077 1125 1034 1059 1052 1070…
Q: Suppose an instructor wants to know the average height, gender distribution, academic performance…
A: Given that an instructor wants to know the average height, gender distribution, academic performance…
Q: Calculate the values for the central line and the control limits for mean chart and then comment on…
A:
Q: Set of population 60 inches, 61 inches, 62 inches, 63 inches, 64 inches, 66 inches, 67 inches…
A: Given: The provide data of population is: 60, 61, 62, 63, 64, 66, 67…
Q: Create a data set of at least seven values that satisfies the condition median < mean
A: Data 2 5 7 8 9 10 12 24 12 12 13
Q: What is interpolation? Discuss the method for constructing the divided difference table for…
A: Interpolation is the method of constructing new data points within the range of a discrete set of…
Q: The Quality Control department of Plainsville Peanut Company is responsible for checking the weight…
A: Quartiles:Quartiles are the values those divides the data into four equal parts.
Q: A state fisheries commission wants to estimate the number of bass caught in a given lake during a…
A: Let Y denote the seasonal catch for a lake Let X denote the size of lake The given R-output is,…
Q: Discuss the use of statistical control tools in manufacturing companies, give practical local…
A: Statistical control tools uses 1. It can be use to reduce the waste of materials. 2. It can also…
Q: An officer was appointed by the Malaysia Energy Commission to study the difference between old and…
A: Population: Set of all Malaysian Households.
Q: The observation values for a random sample with a sample volume of 19 are as follows. X: 18, 11, 17,…
A: Given data: X: 18, 11, 17, 11, 13, 12, 19, 19, 10, 13, 12, 21, 19, 18, 17, 13, 11, 20, 22
Q: Table 1 summarizes the demographic and baseline data. Since two independent groups were included,…
A: Given information: The researcher is specifically interested to study the differences in age…
Q: John Calipari, head basketball coach for the 2012 national championuniversity of Kentucky Wildcats,…
A: Hi! Thank you for the question, As per the honor code, we are allowed to answer three sub-parts at a…
Q: The governor of Florida would like to estimate the mean age of all Florida residents. To do so, he…
A: The population is the set of all subjects of interest.
Q: Complete the ANOVA table. Source df SS MS F Treatments 3 857.1 Error 8 372.8 Total Or just…
A:
Q: Miss Mathica Kumpleto (MMK), a SHS Math teacher in Mathalino National High School would like to find…
A: r
Q: Students from TarlacElementarySchool got scores of91, 91, 99, 94, 94, 92, 93, 92, 94, 95, 89, 92,99,…
A:
Q: Find the value separating the bottom 36% values from the top 64% values. Find the sample mean…
A: Let , X→N(μ=197.5 , σ=69.4) , n=119 Our aim is to find the following : a) Find the value separating…
Q: ) The most inmportant role of Statistics in the Research Process is planning ) The part of…
A: Hi! Thank you for the question, As per the honor code, we are allowed to answer three sub-parts at a…
Q: List three reasons why a replacement study might be needed.
A: Replacement problems involve items that degenerate with use or with the passage of time and those…
Q: Miss Mathica Kumpleto (MMK), a SHS Math teacher in Mathalino National High School would like to find…
A: Given that Miss Mathica Kumpleto (MMK), a SHS Math teacher in Mathalino National High School would…
Q: Define population and sample. List typical parameters from population and sample statistics.
A: It is needed to define the population and sample.
Q: The State of Virginia has instituted a series of standards of learning (SOL) tests in math, history,…
A: Given information Average teacher salary = $27500 Average teacher tenure = 7.8 years Increase in…
Q: A state fisheries commission wants to estimate the number of bass caught in a given lake during a…
A: Given :
Q: Calculate one (1) appropriate measure of central tendency using the data for each teacher and…
A: Given: Essay Quarrie Taylor Wilson Forbes 1 62 63 72 58 2 58 60 65 59 3 63 68 71 60 4 64…
Q: Here are yesterday's high temperatures (in Fahrenheit) in 13 U.S. cities. 48, 57, 60, 60, 66, 68,…
A: The given data is 48, 57, 60, 60, 66, 68, 69, 70, 71, 77, 79, 80, 81.
Q: A state fisheries commission wants to estimate the number of bass caught in a given lake during a…
A: Given that A state fisheries commission wants to estimate the number of bass caught in a given lake…
Q: Several years ago, the state of California launched an aggressive advertisement campaign against…
A: Given data set is 45,48,55,29,44,43,27,49,46,47,52,53,40,39,49,42,37,41,60
Q: 7,12,4,8,3,10,11,5,13,1,12,3,5,1,17,4,8,8,7,17,4,7,1,7,3,7,3,13,3,4,7,8,10,2,5,4,3,5,8 determine…
A: Given data…
Q: Table 1 summarizes the demographic and baseline data. Since two independent groups were included,…
A: Given information: The researcher is specifically interested to study the differences in trauma for…
Q: Create a Frequency Distribution Table and compute for the Mean, Median, Mode, Variance, and Standard…
A: Frequency distribution table is the tabular or graphical representation of the data set that…
Q: The 10,000 meters is a standard track event, and it is a part of both the Olympic Games and World…
A: Men's 10,000 meters at Olympic Games and World Championships in 2015 Rank Time 1 1621.13 2…
please answer item 16-30

Step by step
Solved in 3 steps with 2 images

- Create and fill in a table with columns for (1) bin, (2) absolute frequency, and (3) relative frequency. Draw a histogram of the relative frequency distribution of Commuting Time in your sample. How would you characterize the shape of your histogram (e.g. uniform, symmetric, etc.)?Determine which of the four levels of measurement ( norminal, ordinal, interval, ratio) is most appropriate for the data below. Years in which U.S. presidents were inauguratedCompute the mean, median, and mode of the data sample. (If every number of the set is a solution, enter EVERY in the answer box.) 3, 1, 7, −4, 0, 5 mean median mode
- Angela wants to estimate the mean number of siblings for each student in her school. She records the number of siblings for each of 200randomly selected students in the school. What is the data?Erika operates a website devoted to providing information and support for persons who are interested in organic gardening. According to the hit counter that records daily visitors to her site, the numbers of visits during the past 20 days have been as follows: 65, 36, 52, 70, 37, 55, 63, 59, 68, 56, 63, 63, 43, 46, 73, 41, 47, 75, 75, and 54. Determine the mean and the median for these data. Is there a mode? If so, what is its value?Listed below are the amounts(in millions of dollars) collected from parking meters by a security company in your city in the previous 18 months, alongside the average amounts from another company. These data were used to convict 5 members of the security company in your city of grand larceny. (photo included) What are the means and median for each company? (Type integers or decimals rounded to two decimal places as)