
MATLAB: An Introduction with Applications
6th Edition
ISBN: 9781119256830
Author: Amos Gilat
Publisher: John Wiley & Sons Inc
expand_more
expand_more
format_list_bulleted
Related questions
Question
thumb_up100%
Solve with minitab
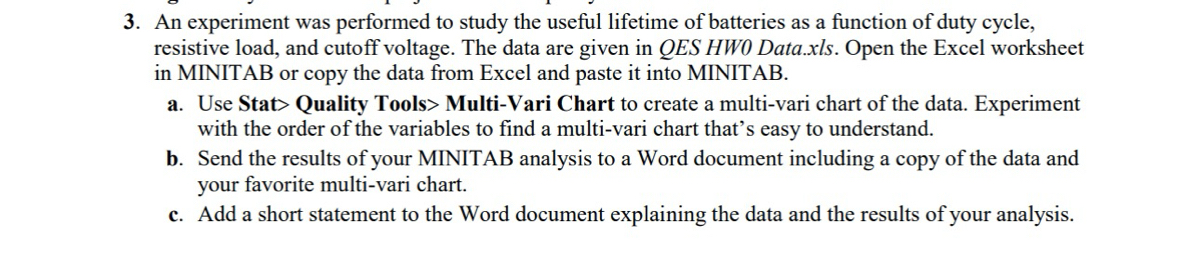

Transcribed Image Text:3. An experiment was performed to study the useful lifetime of batteries as a function of duty cycle,
resistive load, and cutoff voltage. The data are given in QES HWO Data.xls. Open the Excel worksheet
in MINITAB or copy the data from Excel and paste it into MINITAB.
a. Use Stat> Quality Tools> Multi-Vari Chart to create a multi-vari chart of the data. Experiment
with the order of the variables to find a multi-vari chart that's easy to understand.
b. Send the results of your MINITAB analysis to a Word document including a copy of the data and
your favorite multi-vari chart.
c. Add a short statement to the Word document explaining the data and the results of your analysis.

Transcribed Image Text:DutyCycle
100
100
100
17
17
17
100
100
100
17
17
17
100
100
100
17
17
17
100
100
100
17
17
17
100
100
100
17
17
17
Load
8.0
25.0
100.0
8.0
25.0
100.0
8.0
25.0
100.0
8.0
25.0
100.0
8.0
25.0
100.0
8.0
25.0
100.0
8.0
25.0
100.0
8.0
25.0
100.0
8.0
25.0
100.0
8.0
25.0
100.0
Cutoff Voltage
0.8
0.8
0.8
0.8
0.8
0.8
0.9
0.9
0.9
0.9
0.9
0.9
1
1
1
1
1
1
1.1
1.1
1.1
1.1
1.1
1.1
1.2
1.2
1.2
1.2
1.2
1.2
Hours
17
75
430
20
98
430
11
51
365
17
89
380
7.2
43
320
15
81
360
38
290
9.2
70
345
3.2
28
240
5.1
60
310
Expert Solution
This question has been solved!
Explore an expertly crafted, step-by-step solution for a thorough understanding of key concepts.

Step by stepSolved in 3 steps with 1 images

Knowledge Booster

Similar questions
Recommended textbooks for you
- MATLAB: An Introduction with ApplicationsStatisticsISBN:9781119256830Author:Amos GilatPublisher:John Wiley & Sons Inc
 Probability and Statistics for Engineering and th...StatisticsISBN:9781305251809Author:Jay L. DevorePublisher:Cengage Learning
 Statistics for The Behavioral Sciences (MindTap C...StatisticsISBN:9781305504912Author:Frederick J Gravetter, Larry B. WallnauPublisher:Cengage Learning
  Elementary Statistics: Picturing the World (7th E...StatisticsISBN:9780134683416Author:Ron Larson, Betsy FarberPublisher:PEARSON
 The Basic Practice of StatisticsStatisticsISBN:9781319042578Author:David S. Moore, William I. Notz, Michael A. FlignerPublisher:W. H. Freeman
 Introduction to the Practice of StatisticsStatisticsISBN:9781319013387Author:David S. Moore, George P. McCabe, Bruce A. CraigPublisher:W. H. Freeman
MATLAB: An Introduction with Applications
Statistics
ISBN:9781119256830
Author:Amos Gilat
Publisher:John Wiley & Sons Inc
Probability and Statistics for Engineering and th...
Statistics
ISBN:9781305251809
Author:Jay L. Devore
Publisher:Cengage Learning
Statistics for The Behavioral Sciences (MindTap C...
Statistics
ISBN:9781305504912
Author:Frederick J Gravetter, Larry B. Wallnau
Publisher:Cengage Learning
Elementary Statistics: Picturing the World (7th E...
Statistics
ISBN:9780134683416
Author:Ron Larson, Betsy Farber
Publisher:PEARSON
The Basic Practice of Statistics
Statistics
ISBN:9781319042578
Author:David S. Moore, William I. Notz, Michael A. Fligner
Publisher:W. H. Freeman
Introduction to the Practice of Statistics
Statistics
ISBN:9781319013387
Author:David S. Moore, George P. McCabe, Bruce A. Craig
Publisher:W. H. Freeman