
MATLAB: An Introduction with Applications
6th Edition
ISBN: 9781119256830
Author: Amos Gilat
Publisher: John Wiley & Sons Inc
expand_more
expand_more
format_list_bulleted
Related questions
Question

Transcribed Image Text:.
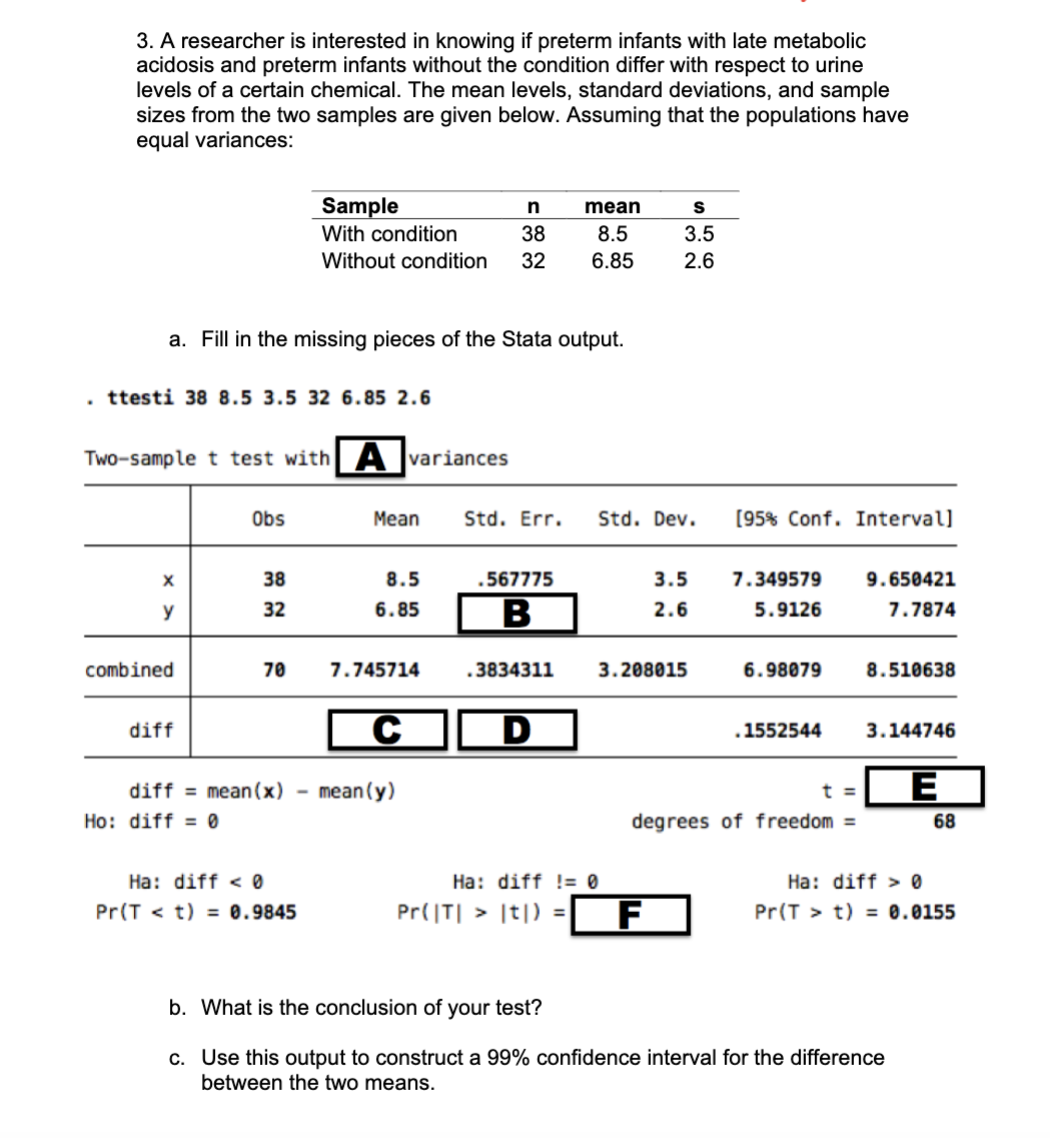
3. A researcher is interested in knowing if preterm infants with late metabolic
acidosis and preterm infants without the condition differ with respect to urine
levels of a certain chemical. The mean levels, standard deviations, and sample
sizes from the two samples are given below. Assuming that the populations have
equal variances:
a. Fill in the missing pieces of the Stata output.
ttesti 38 8.5 3.5 32 6.85 2.6
X
y
Two-sample t test with A variances
combined
diff
Obs
Ho: diff=0
38
32
Sample
With condition
70
diff mean(x)
n
38
Without condition 32
Ha: diff < 0
Pr(Tt) = 0.9845
Mean
8.5
6.85
7.745714
C
mean (y)
mean
8.5
6.85
.567775
B
Std. Err. Std. Dev.
.3834311
S
3.5
2.6
3.5
2.6
3.208015
Ha: diff != 0
Pr(|T| > |t|) = F
[95% Conf. Intervall
7.349579
5.9126
6.98079
.1552544
t =
degrees of freedom =
9.650421
7.7874
8.510638
3.144746
E
b. What is the conclusion of your test?
c. Use this output to construct a 99% confidence interval for the difference
between the two means.
68
Ha: diff0
Pr(Tt) = 0.0155
Expert Solution
This question has been solved!
Explore an expertly crafted, step-by-step solution for a thorough understanding of key concepts.

This is a popular solution

Trending nowThis is a popular solution!

Step by stepSolved in 4 steps with 2 images

Knowledge Booster

Similar questions
- The Ministry of Education has commissioned a study to determine students’ reading ability based on the level of illumination they were given for the type of reading material. The results of the trial are given below: 1. Conduct the appropriate statistical analyses to compare the reading ability for the two types of reading material while controlling for level of illumination. Clearly outline all your tests.2. What is your conclusion? 3. Has the assumptions of normality and homogeneity of variance been met? (Quote relevant statistics in your response and provide the necessary hypotheses)4. The JASP output and input of all the statistical analyses performed PLEASE INSERT ALL CALCULATIONS USING JASP SOFTWAREarrow_forward(5). Calculate SS, variance and standard deviation for the following sample of n=7 scores: 8, 6, 5, 2, 6, 3, 5.arrow_forwardA researcher takes sample temperatures in Fahrenheit of 16 days from San Francisco (Group 1) and 22 days from Atlanta (Group 2). Test the claim that the mean temperature in San Francisco is less than the mean temperature in Atlanta. Use a significance level of a = 0.10. Assume the populations are approximately normally distributed with unequal variances. You obtain the following two samples of data. Round answers to 4 decimal places. San Francisco 77.4 94.8 77 80.9 84 Ho: M₁ 73.4 84.9 92 60.6 83.6 92.5 76.3 93.4 87.2 81.5 70.4 What are the correct hypotheses? Note this may view better in full screen mode. Select the correct symbols for each of the 6 spaces. Atlanta 85.4 92.8 80.2 87.9 80.6 77.9 72.9 75.9 72.1 76.7 80.4 92.5 75.9 72.1 97.7 89.2 88.1 80 92.2 86 96.2 91.9 p-value H₁: M₁ Based on the hypotheses, find the following: Test Statistic = -0.635 X = 0.2494 × OH₂ The p-value is greater than alpha OF H₂ to alpha. The correct decision is to fail to reject the null hypothesis or The…arrow_forward
- The accompanying table lists pulse rates. Use a 0.05 significance level and apply the methods of two-way analysis of variance. What is the conclusion? Click on the icon to view the data table. State the null and alternative hypotheses in the test for the effect of an interaction between row and column factors. Ho: There interaction between gender and age. H₁: There interaction between gender and age. Pulse Rates for Gender and Age C Under 30 Years of Age Over 30 Years of Age Female 78 103 78 63 61 98 81 98 91 95 77 75 73 65 71 78 61 71 74 55 Female Male 60 81 56 69 68 74 75 68 63 56 46 70 61 65 91 80 59 58 64 59 Male Print Done Darrow_forwardA new study has found that, on average, 6- to 12-year-old children are spending less time on household chores today compared to 1981 levels. Suppose two samples representative of the study's results report the following summary statistics for the two periods. 1981 Levels 2008 Levels 24 minutes 19 minutes 51 = 3.5 minutes 52 - 4.3 minutes ni = 30 n2 - 30 Which of the following is the correct value of the test statistic assuming that the unknown population variances are equal? Multiple Cholce Z = -4.94 tss = 4.94 Z = 4.94 t59 = -4.94arrow_forwardA researcher takes sample temperatures in Fahrenheit of 17 days from New York City and 18 days from Phoenix. Test the claim that the mean temperature in New York City is different from the mean temperature in Phoenix. Use a significance level of α=0.05. Assume the populations are approximately normally distributed with unequal variances. You obtain the following two samples of data. New York City Phoenix 99 94.2 95.5 72 93.2 86.8 102 122.1 85.4 114.4 80 94.7 86.4 89.7 75.4 104.7 79.5 77.6 83.4 106.8 64.3 98.6 65.5 91.5 87.7 82 104 97.7 74.3 64.9 59.5 82 82.8 72 116.2 The Hypotheses for this problem are: H0: μ1 = μ2 H1: μ1μ2 Find the p-value. Round answer to 4 decimal places. Make sure you put the 0 in front of the decimal. p-value =arrow_forward
- Two accounting professors decided to test if the variance of their grades is different or no. To accomplish this, they each graded the same 10 exams with the following results: Standard Deviation 22.4 Mean Grade Professor 1 79.3 Professor 2 82.1 12.0 F What is the P-value of the test? Select one: a. between 0.01 and 0.025 Ob. between 0.025 and 0.05 C. between 0.05 and 0.10 Od. bigger than 0.10arrow_forward???arrow_forwardThe following is a sample of patient's calcium tests in mg/dL. 9.3 8.8 10.1 8.9 9.4 9.8 10.0 9.9 11.2 12.1 Find each of the following: The mean: The median: The third quartile: The standard deviation: The variance:arrow_forward
- Choose the appropriate statistical test. When computing, be sure to round each answer as indicated. A dentist wonders if depression affects ratings of tooth pain. In the general population, using a scale of 1-10 with higher values indicating more pain, the average pain rating for patients with toothaches is 6.8. A sample of 30 patients that show high levels of depression have an average pain rating of 7.1 (variance 0.8). What should the dentist determine? 1. Calculate the estimated standard error. (round to 3 decimals). [st.error] 2. What is thet-obtained? (round to 3 decimals). 3. What is the t-cv? (exact value) 4. What is your conclusion? Only type "Reject" or Retain"arrow_forwardScientists measured the amount of drug in tablets produced at two different, independent sites. Scientists want to know whether there is any difference between the mean drug concentration in tablets produced at Site 1 and Site 2. Run the appropriate test in Excel, assuming the population variances are equal. Use an a = .05 significance level. Submit the...arrow_forwardQuestion 16: Please use the approporate stats table attached. Do not use a software for this problem.a. What was the observed difference between the mean PCV levels for the two groups? b.Assuming that the two groups have similar variances, estimate the standard error of the difference between the sample means c. Conduct an appropriate test to assess the difference between the two means. What do you conclude?arrow_forward
arrow_back_ios
SEE MORE QUESTIONS
arrow_forward_ios
Recommended textbooks for you
- MATLAB: An Introduction with ApplicationsStatisticsISBN:9781119256830Author:Amos GilatPublisher:John Wiley & Sons Inc
 Probability and Statistics for Engineering and th...StatisticsISBN:9781305251809Author:Jay L. DevorePublisher:Cengage Learning
 Statistics for The Behavioral Sciences (MindTap C...StatisticsISBN:9781305504912Author:Frederick J Gravetter, Larry B. WallnauPublisher:Cengage Learning
  Elementary Statistics: Picturing the World (7th E...StatisticsISBN:9780134683416Author:Ron Larson, Betsy FarberPublisher:PEARSON
 The Basic Practice of StatisticsStatisticsISBN:9781319042578Author:David S. Moore, William I. Notz, Michael A. FlignerPublisher:W. H. Freeman
 Introduction to the Practice of StatisticsStatisticsISBN:9781319013387Author:David S. Moore, George P. McCabe, Bruce A. CraigPublisher:W. H. Freeman
MATLAB: An Introduction with Applications
Statistics
ISBN:9781119256830
Author:Amos Gilat
Publisher:John Wiley & Sons Inc
Probability and Statistics for Engineering and th...
Statistics
ISBN:9781305251809
Author:Jay L. Devore
Publisher:Cengage Learning
Statistics for The Behavioral Sciences (MindTap C...
Statistics
ISBN:9781305504912
Author:Frederick J Gravetter, Larry B. Wallnau
Publisher:Cengage Learning
Elementary Statistics: Picturing the World (7th E...
Statistics
ISBN:9780134683416
Author:Ron Larson, Betsy Farber
Publisher:PEARSON
The Basic Practice of Statistics
Statistics
ISBN:9781319042578
Author:David S. Moore, William I. Notz, Michael A. Fligner
Publisher:W. H. Freeman
Introduction to the Practice of Statistics
Statistics
ISBN:9781319013387
Author:David S. Moore, George P. McCabe, Bruce A. Craig
Publisher:W. H. Freeman