
MATLAB: An Introduction with Applications
6th Edition
ISBN: 9781119256830
Author: Amos Gilat
Publisher: John Wiley & Sons Inc
expand_more
expand_more
format_list_bulleted
Related questions
Question

Transcribed Image Text:**Educational Content: Statistical Analysis Using Excel**
**Task Overview:**
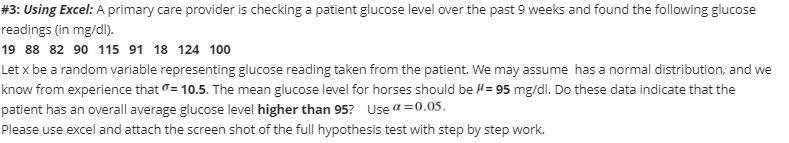
A primary care provider is analyzing a patient’s glucose levels over the past 9 weeks. The glucose readings (in mg/dl) are as follows:
19, 88, 82, 90, 115, 91, 18, 124, 100
**Statistical Problem:**
Let \( x \) be a random variable representing a glucose reading taken from the patient. It is assumed that this follows a normal distribution with a known standard deviation \( \sigma = 10.5 \).
The mean glucose level for horses is \( \mu = 95 \) mg/dl. We want to determine if the patient's overall average glucose level is higher than 95 mg/dl.
**Significance Level:**
Use \( \alpha = 0.05 \).
**Instructions:**
Utilize Excel to conduct a hypothesis test to check if the average glucose level is indeed higher than 95. Attach a screenshot of the full hypothesis test including step-by-step work.
**Graph/Diagram Explanation:**
There are no graphs or diagrams provided in the text. Use Excel's functionality to aid in visualizing data (e.g., histograms or normal distribution curves) if needed.
Expert Solution
This question has been solved!
Explore an expertly crafted, step-by-step solution for a thorough understanding of key concepts.

Step by stepSolved in 5 steps

Knowledge Booster

Similar questions
- Identify the data value corresponding to the indicated percentile. The amount of sleep an adult gets per day is normally distributed with a mean of 7 hours and a standard deviation of 1.5 hours. Five percent of adults sleep more than how many hours per day?arrow_forwardPlease show all work/stepsarrow_forwardA violin student records the number of hours they spend practicing during each of ten consecutive weeks. 5.4 4.4 What is the first quartile for this data? 4.4 4.9 2.7 4.5 5.9 2.1 3.9 3.4arrow_forward
- Patients with two kinds of diagnoses were randomly assigned to one of three types of therapy and the effectiveness of the therapy was measured on a 1-to-15 scale (with a higher number indicating greater effectiveness). There were two patients per cell. Use the data available below to complete parts through (d) below. Click the icon to view the data table. Click here to view page 1 of the table of cutoff values for the F distribution. Click here to view page 2 of the table of cutoff values for the F distribution. Click here to view page 3 of the table of cutoff values for the F distribution. Click here to view page 4 of the table of cutoff values for the F distribution. (a) Carry out the analysis of variance (use the 0.05 significance level). Complete the analysis of variance table for the data set below. SS MS Source Columns Rows Interaction Within Total (Round to two decimal places as needed.) df F Data Table Diagnosis Diagnosis II Therapy A 5 1 11 7 Print Therapy B 7 5 12 Done…arrow_forwardNeed help with this one in part D.arrow_forwardPatients with two kinds of diagnoses were randomly assigned to one of three types of therapy and the effectiveness of the therapy was measure a 1-to-15 scale (with a higher number indicating greater effectiveness). There were two patients per cell. Use the data available below to comple parts (a) through (d) below. Click the icon to view the data table. Click here to view page 1 of the table of cutoff values for the F distribution. Click here to view page 2 of the table of cutoff values for the F distribution. Click here to view page 3 of the table of cutoff values for the F distribution. Click here to view page 4 of the table of cutoff values for the F distribution (a) Carry out the analysis of variance (use the 0.05 significance level). Complete the analysis of variance table for the data set below. SS MS F Source Columns Rows Interaction Within Total (Round to two decimal places as needed.) Data Table Diagnosis I Diagnosis II Therapy A 5 1 7 Print Therapy B 7 12 Done Therapy C 4282…arrow_forward
- Meredith Grey has asked every surgeon at Grey-Sloan Memorial Hospital the following question: "How many surgeries have you scrubbed in on in the past 30 days?" The results are shown below. Number of surgeries 30 40 50 50 90 55 70 70 85 55 70 85 85 55 65 80 60 85 70 80 75 85 135 90 80 85 95 50 75 75 Find the following measures of center. Mean = Median = Mode =arrow_forward_________ are used to display actual data points for individual-level data. Would this answer be Univariate Statistics?arrow_forwardConsider the following data: −10, −10, 0, 3, −10, 3, 3 Step 1 of 3: Calculate the value of the sample Variance. Round your answer to one decimal place. Step 2 of 3: Calculate the value of the sample deviation. Round your answer to one decimal place. Step 3 of 3: Calculate the value of the range.arrow_forward
arrow_back_ios
arrow_forward_ios
Recommended textbooks for you
- MATLAB: An Introduction with ApplicationsStatisticsISBN:9781119256830Author:Amos GilatPublisher:John Wiley & Sons Inc
 Probability and Statistics for Engineering and th...StatisticsISBN:9781305251809Author:Jay L. DevorePublisher:Cengage Learning
 Statistics for The Behavioral Sciences (MindTap C...StatisticsISBN:9781305504912Author:Frederick J Gravetter, Larry B. WallnauPublisher:Cengage Learning
  Elementary Statistics: Picturing the World (7th E...StatisticsISBN:9780134683416Author:Ron Larson, Betsy FarberPublisher:PEARSON
 The Basic Practice of StatisticsStatisticsISBN:9781319042578Author:David S. Moore, William I. Notz, Michael A. FlignerPublisher:W. H. Freeman
 Introduction to the Practice of StatisticsStatisticsISBN:9781319013387Author:David S. Moore, George P. McCabe, Bruce A. CraigPublisher:W. H. Freeman
MATLAB: An Introduction with Applications
Statistics
ISBN:9781119256830
Author:Amos Gilat
Publisher:John Wiley & Sons Inc
Probability and Statistics for Engineering and th...
Statistics
ISBN:9781305251809
Author:Jay L. Devore
Publisher:Cengage Learning
Statistics for The Behavioral Sciences (MindTap C...
Statistics
ISBN:9781305504912
Author:Frederick J Gravetter, Larry B. Wallnau
Publisher:Cengage Learning
Elementary Statistics: Picturing the World (7th E...
Statistics
ISBN:9780134683416
Author:Ron Larson, Betsy Farber
Publisher:PEARSON
The Basic Practice of Statistics
Statistics
ISBN:9781319042578
Author:David S. Moore, William I. Notz, Michael A. Fligner
Publisher:W. H. Freeman
Introduction to the Practice of Statistics
Statistics
ISBN:9781319013387
Author:David S. Moore, George P. McCabe, Bruce A. Craig
Publisher:W. H. Freeman