
MATLAB: An Introduction with Applications
6th Edition
ISBN: 9781119256830
Author: Amos Gilat
Publisher: John Wiley & Sons Inc
expand_more
expand_more
format_list_bulleted
Related questions
Concept explainers
Question
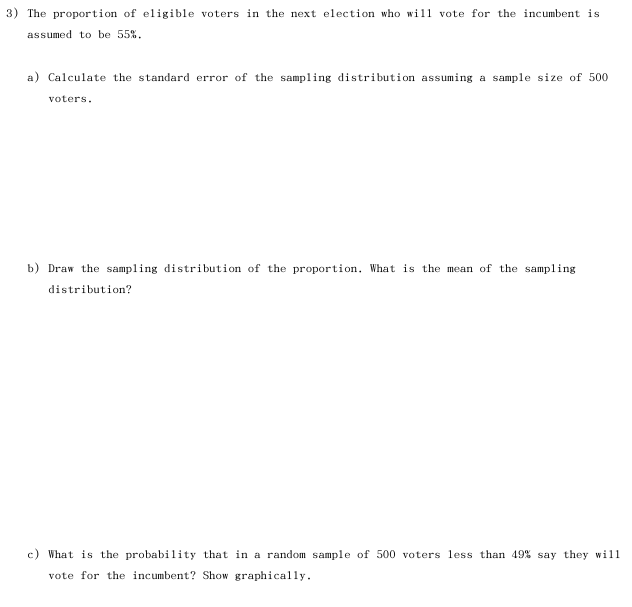

Transcribed Image Text:3) The proportion of eligible voters in the next election who will vote for the incumbent is
assumed to be 55%.
a) Calculate the standard error of the sampling distribution assuming a sample size of 500
voters.
b) Draw the sampling distribution of the proportion. What is the mean of the sampling
distribution?
c) What is the probability that in a random sample of 500 voters less than 49% say they wil1
vote for the incumbent? Show graphically.
Expert Solution
This question has been solved!
Explore an expertly crafted, step-by-step solution for a thorough understanding of key concepts.

This is a popular solution

Trending nowThis is a popular solution!

Step by stepSolved in 3 steps with 5 images

Knowledge Booster


Learn more about
Need a deep-dive on the concept behind this application? Look no further. Learn more about this topic, statistics and related others by exploring similar questions and additional content below.Similar questions
- Cal Poly Pomona found that 15% of its students withdraw without completing Calculus I course. Assume that 30 students registered for the course. Let X be the number of students who withdraw. What distribution does X follow?arrow_forward16. In a distribution skewed to the right: select one:arrow_forwardRecent studies have shown that about 16% of American adults fit the medical definition of being obese. A large medical clinic would like to estimate what percentage of their patients are obese, so they take a random sample of 400 patients and find that 52 are obese. Suppose that in truth, the same percentage holds for the patients of the medical clinic as for the general population, 16%. Find the mean of the sampling distribution of p̂.arrow_forward
- A. Find the proportion runners with the time less than 160 minutes? Show work B. Find the proportion of times 201 minutes or 209 minutes ? Show work C. Describe the shape of the distribution? Identify the class that contains the 50th percentile. is this a typical time ?identify the runners in the 50th percentile. Show workarrow_forwardThe average final exam score for the statistics course is 74%. A professor wants to see if the average final exam score for students who are given colored pens on the first day of class is lower. The final exam scores for the 12 randomly selected students who were given the colored pens are shown below. Assume that the distribution of the population is normal. 51, 86, 77, 86, 66, 59, 66, 76, 55, 59, 57, 80 What can be concluded at the α = 0.10 level of significance? For this study, we should use Select an answer t-test for a population mean z-test for a population proportion H0:H0: ? μ p Select an answer = ≠ > < H1:H1: ? p μ Select an answer = > < ≠ The test statistic ? t z = (please show your answer to 3 decimal places.) The p-value = (Please show your answer to 4 decimal places.)arrow_forward4. Find each value requested for the distribution of scores in the following table. а. п b. ΣΧ C. Σχ f 1 4 2 3 3 2 5 1 3 UNGarrow_forward
- can you help for answer this ?arrow_forwardThe average final exam score for the statistics course is 82%. A professor wants to see if the average final exam score for students who are given colored pens on the first day of class is different. The final exam scores for the 14 randomly selected students who were given the colored pens are shown below. Assume that the distribution of the population is normal. 90, 78, 82, 59, 67, 71, 64, 78, 67, 57, 79, 86, 66, 56 What can be concluded at the the αα = 0.05 level of significance level of significance? For this study, we should use (t-test for a population mean, z-test for a population proportion) The null and alternative hypotheses would be: H0: (symbol) (symbol) ____ H1: (symbol) (symbol) ____ The test statistic (?,t,z) = ____ (please show your answer to 3 decimal places.) The p-value = (Please show your answer to 4 decimal places.) The p-value is (symbol) αα Based on this, we should (accept, reject, fail to reject) the null hypothesis.…arrow_forwardAs the sample size increases, the mean of the sampling distribution ▼ stays the same. gets larger. gets smaller.arrow_forward
- Using the data attached, compute x-bar: 1. Define the random variable x-bar in words 2. state the estimated distribution to use. Use both words and symbols.arrow_forwardThe average final exam score for the statistics course is 74%. A professor wants to see if the average final exam score for students who are given colored pens on the first day of class is different. The final exam scores for the 14 randomly selected students who were given the colored pens are shown below. Assume that the distribution of the population is normal. 71, 72, 53, 61, 75, 55, 75, 74, 58, 50, 71, 84, 76, 53 What can be concluded at the the αα = 0.10 level of significance level of significance? The null and alternative hypotheses would be: H0: μ = ______________ H1: μ ≠ ______________ The test statistic t= ________________(please show your answer to 3 decimal places.) The p-value = _______________________ (Please show your answer to 4 decimal places.)arrow_forward
arrow_back_ios
arrow_forward_ios
Recommended textbooks for you
- MATLAB: An Introduction with ApplicationsStatisticsISBN:9781119256830Author:Amos GilatPublisher:John Wiley & Sons Inc
 Probability and Statistics for Engineering and th...StatisticsISBN:9781305251809Author:Jay L. DevorePublisher:Cengage Learning
 Statistics for The Behavioral Sciences (MindTap C...StatisticsISBN:9781305504912Author:Frederick J Gravetter, Larry B. WallnauPublisher:Cengage Learning
  Elementary Statistics: Picturing the World (7th E...StatisticsISBN:9780134683416Author:Ron Larson, Betsy FarberPublisher:PEARSON
 The Basic Practice of StatisticsStatisticsISBN:9781319042578Author:David S. Moore, William I. Notz, Michael A. FlignerPublisher:W. H. Freeman
 Introduction to the Practice of StatisticsStatisticsISBN:9781319013387Author:David S. Moore, George P. McCabe, Bruce A. CraigPublisher:W. H. Freeman
MATLAB: An Introduction with Applications
Statistics
ISBN:9781119256830
Author:Amos Gilat
Publisher:John Wiley & Sons Inc
Probability and Statistics for Engineering and th...
Statistics
ISBN:9781305251809
Author:Jay L. Devore
Publisher:Cengage Learning
Statistics for The Behavioral Sciences (MindTap C...
Statistics
ISBN:9781305504912
Author:Frederick J Gravetter, Larry B. Wallnau
Publisher:Cengage Learning
Elementary Statistics: Picturing the World (7th E...
Statistics
ISBN:9780134683416
Author:Ron Larson, Betsy Farber
Publisher:PEARSON
The Basic Practice of Statistics
Statistics
ISBN:9781319042578
Author:David S. Moore, William I. Notz, Michael A. Fligner
Publisher:W. H. Freeman
Introduction to the Practice of Statistics
Statistics
ISBN:9781319013387
Author:David S. Moore, George P. McCabe, Bruce A. Craig
Publisher:W. H. Freeman