
MATLAB: An Introduction with Applications
6th Edition
ISBN: 9781119256830
Author: Amos Gilat
Publisher: John Wiley & Sons Inc
expand_more
expand_more
format_list_bulleted
Related questions
Question
Answer A, B, and C.
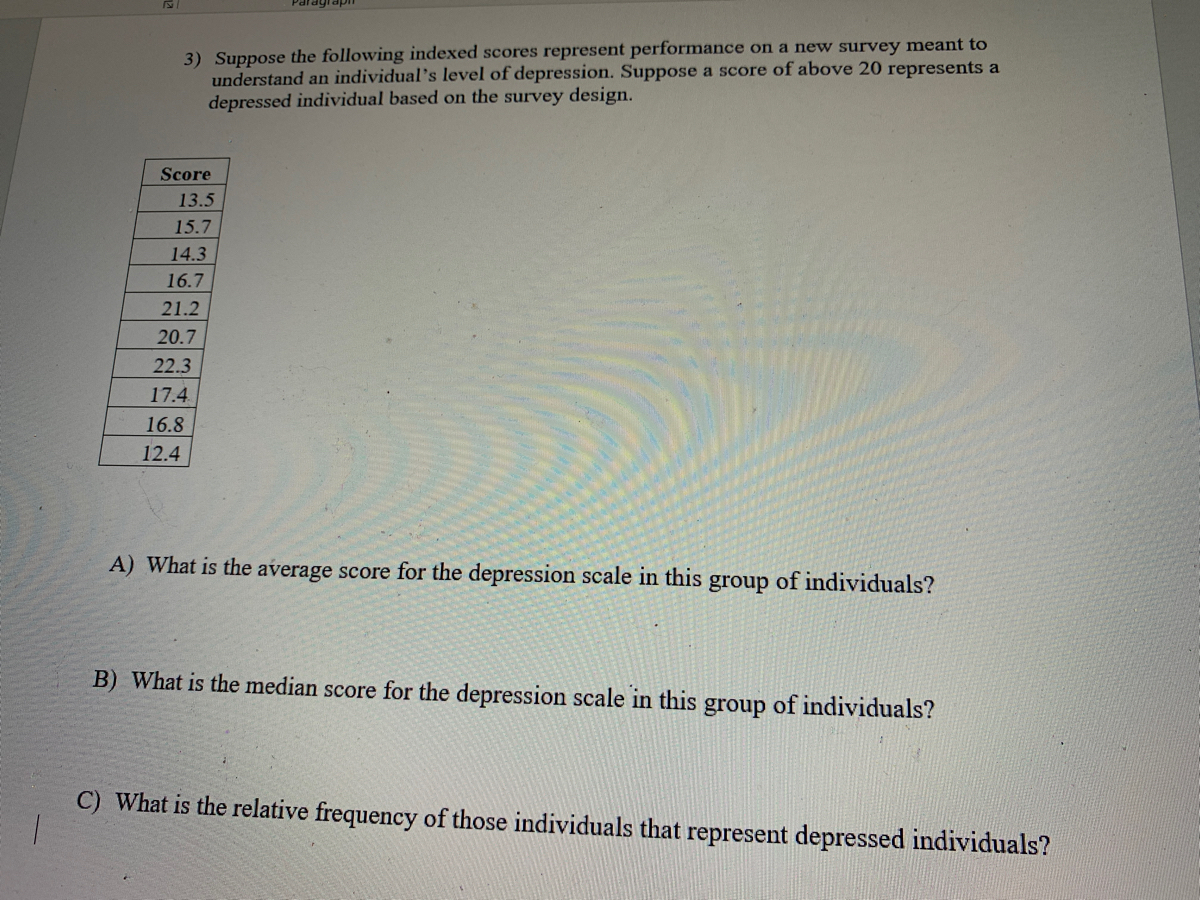

Transcribed Image Text:3) Suppose the following indexed scores represent performance on a new survey meant to
understand an individual's level of depression. Suppose a score of above 20 represents a
depressed individual based on the survey design.
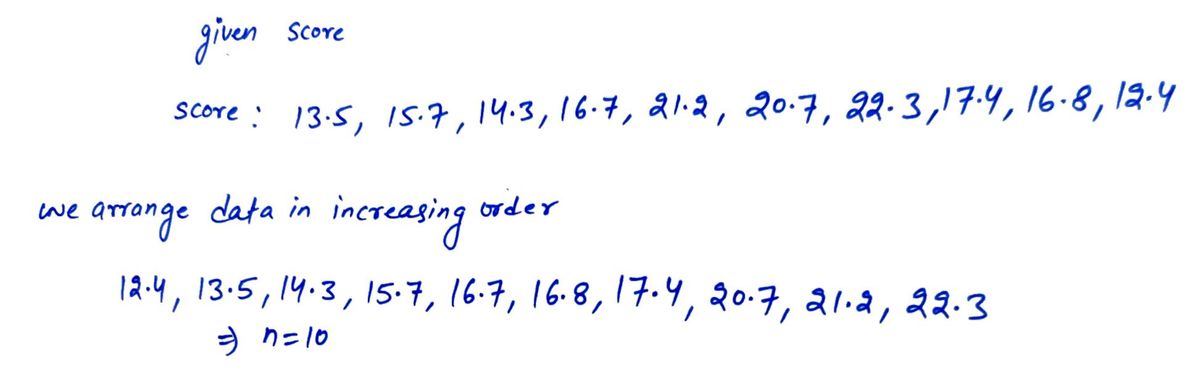
Score
13.5
15.7
14.3
16.7
21.2
20.7
22.3
17.4
16.8
12.4
A) What is the average score for the depression scale in this
group
of individuals?
B) What is the median score for the depression scale in this group of individuals?
C) What is the relative frequency of those individuals that represent depressed individuals?
Expert Solution
arrow_forward
Step 1

Trending nowThis is a popular solution!

Step by stepSolved in 2 steps with 2 images

Knowledge Booster

Similar questions
- For following function, select (on the same set of coordinate axes) a graph of function for c = 3, 1 and–3. [x²+c,x<0 -x2+c, x20 f(x) = -5 -4 -3 -2\-1. 5 3 4 2+ -3 2 + -5 -4 -3 -2 + 3 4 5 1 2 -2 -3 -5arrow_forwardAccording to the table above please answer d and e as well.arrow_forwardLet a = (5, 1, −1) and | 6 6 = (2, 1, 4). Find a. b.arrow_forward
arrow_back_ios
arrow_forward_ios
Recommended textbooks for you
- MATLAB: An Introduction with ApplicationsStatisticsISBN:9781119256830Author:Amos GilatPublisher:John Wiley & Sons Inc
 Probability and Statistics for Engineering and th...StatisticsISBN:9781305251809Author:Jay L. DevorePublisher:Cengage Learning
 Statistics for The Behavioral Sciences (MindTap C...StatisticsISBN:9781305504912Author:Frederick J Gravetter, Larry B. WallnauPublisher:Cengage Learning
  Elementary Statistics: Picturing the World (7th E...StatisticsISBN:9780134683416Author:Ron Larson, Betsy FarberPublisher:PEARSON
 The Basic Practice of StatisticsStatisticsISBN:9781319042578Author:David S. Moore, William I. Notz, Michael A. FlignerPublisher:W. H. Freeman
 Introduction to the Practice of StatisticsStatisticsISBN:9781319013387Author:David S. Moore, George P. McCabe, Bruce A. CraigPublisher:W. H. Freeman
MATLAB: An Introduction with Applications
Statistics
ISBN:9781119256830
Author:Amos Gilat
Publisher:John Wiley & Sons Inc
Probability and Statistics for Engineering and th...
Statistics
ISBN:9781305251809
Author:Jay L. Devore
Publisher:Cengage Learning
Statistics for The Behavioral Sciences (MindTap C...
Statistics
ISBN:9781305504912
Author:Frederick J Gravetter, Larry B. Wallnau
Publisher:Cengage Learning
Elementary Statistics: Picturing the World (7th E...
Statistics
ISBN:9780134683416
Author:Ron Larson, Betsy Farber
Publisher:PEARSON
The Basic Practice of Statistics
Statistics
ISBN:9781319042578
Author:David S. Moore, William I. Notz, Michael A. Fligner
Publisher:W. H. Freeman
Introduction to the Practice of Statistics
Statistics
ISBN:9781319013387
Author:David S. Moore, George P. McCabe, Bruce A. Craig
Publisher:W. H. Freeman