
ENGR.ECONOMIC ANALYSIS
14th Edition
ISBN: 9780190931919
Author: NEWNAN
Publisher: Oxford University Press
expand_more
expand_more
format_list_bulleted
Related questions
Question

Transcribed Image Text:3
Ask
Mc
Graw
Hill
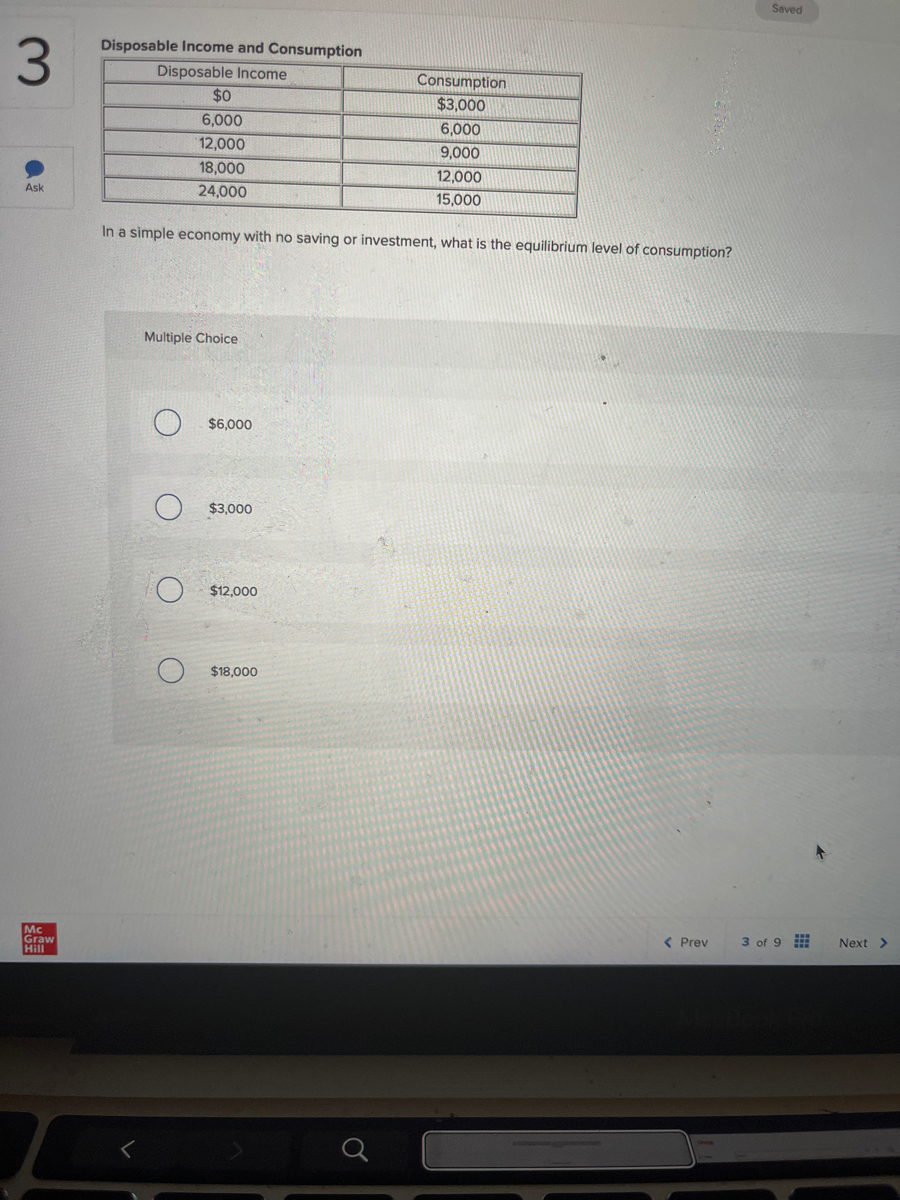
Disposable Income and Consumption
Disposable Income
$0
6,000
12,000
18,000
Consumption
$3,000
6,000
9,000
12,000
15,000
24,000
In a simple economy with no saving or investment, what is the equilibrium level of consumption?
Multiple Choice
$6,000
$3,000
$12,000
$18,000
Saved
< Prev
3 of 9
Next >
Expert Solution
This question has been solved!
Explore an expertly crafted, step-by-step solution for a thorough understanding of key concepts.

Step by stepSolved in 2 steps

Knowledge Booster

Similar questions
- 5 Output and Consumption (in millions of dollars) Real GDP (Y) Consumption (C) Gross Investment (1) Government Purchases (G) 42 28 9 Ask Net Exports (NX) Mc Graw Hill -2 What is the equilibrium level of ouput? Multiple Choice O $42 million О $28 million $84 million $14 million Parrow_forward3. The meaning of saving and investment Classify each of the following based on the macroeconomic definitions of saving and investment. Saving Investment Caroline purchases new ovens for her cupcake-baking business. Antonio buys a government bond. Dmitri takes out a loan and uses it to build a new cabin in Montana. Frances purchases stock in Pherk, a pharmaceutical company.arrow_forwardB V F Di D2 a movement from Point A to Point B Refer to Figure 1. Which of the following movements shows the effects of households' decision to save more? a movement from Point F to Point A 52 a movement from Point C to Point F S1 a movement from Point B to Point Carrow_forward
- The following table contains data on the relationship between saving and income. a. Rearrange the income and saving data into an ascending order of income and graph them on the accompanying grid. Income per Year $ Saving per Year 15,000 $ 0 10,000 5,000 20,000 1,000 -500 500 0 1,500 Rearranged Rearranged Income per Year Saving per Yeararrow_forwardQuèstion 4 "As disposable income increases, consumption:" O And saving both increase. O Decreases and saving increases. O And saving both decrease. O Increases and saving decreases.arrow_forward1. Complete this chart. ***Remember, you are looking at the change in income and spending. ( Income $20,000 $40,000 $60,000 $80,000 Expenditures MPC N/A $11,000 $25,000 $35,000 $41,000 MPS N/Aarrow_forward
- If consumption of household is $3500 and income is $5000 Calculate savingarrow_forwardColumn 1 Column 2 Column 3 Column 4 Column 5 Units of Units of Units of Units of Number of MU MU MU MU MU Good A Good B Good C Good D Dollars Saved 1 72.00 1 24.00 1 15.00 1 36.00 1 5.00 2 54.00 2 15.00 2 12.00 2 30.00 2 4.00 3 45.00 3 12.00 3 8.00 3 24.00 3 3.00 4 36.00 4 9.00 4 7.00 4 18.00 4 2.00 5 27.00 5 7.00 5 5.00 5 13.00 5 1.00 6 18.00 6 5.00 6 4.00 6 7.00 6 0.50 7 15.00 7 2.00 7 3.50 7 4.00 7 0.25 8 12.00 8 1.00 8 3.00 8 2.00 8 0.13 Columns 1 through 4 in the accompanying table show the marginal utility that Ralph Burgundy would get by purchasing various amounts of products A, B, C, and D, while Column 5 shows the marginal utility from saving. Assume that P of good A is $36.00, the P of good B is $12.00, the P of good C is $8.00, and the P of good D is $48.00, while only $209 is the amount available for spending. How many units of B will be purchased? 05 11arrow_forwardOnly typed answer and don't use chat gptarrow_forward
- 25 00:53:53 2000 Expenditures 1500 1000 500 500 1000 Disposable Income When disposable income is 1,000, I is Multiple Choice O 100 200 1500 2000 annarrow_forwardThe next three questions involve the following situation. Consider a closed economy in which I $100, 000, 000, 000, and T = $30, 000, 000, 000. $20, 000, 000, 000, G = $45, 000, 000, 000, Y = 1. What is total saving, S? (A) -$30 billion. (B) $35 billion. (C) -$15 billion. (D) $20 billion. 2. What is consumption? (A) $15 billion. (B) $35 billion. (C) -$15 billion. (D) -$35 billion. 3. What is private saving? (A) $15 billion. (B) $35 billion. (C) -$15 billion. (D) -$35 billion. 4. Which of the following assets performs best in times of demand-pull inflation? (A) Gold. (B) Agricultural real estate. (C) Stocks. (D) Bonds.arrow_forwardExhibit 18-4 Total Spending (billions of dollars) 2015 2016 C 3,906 4,140 O $717 billion O $1,079 billion $737 billion I $1,816 billion 737 797 G O Not enough information is given. 1,099 According to the data in Exhibit 18-4, 2015 national saving equaled 1,132 X -20 -30arrow_forward
arrow_back_ios
SEE MORE QUESTIONS
arrow_forward_ios
Recommended textbooks for you
 Principles of Economics (12th Edition)EconomicsISBN:9780134078779Author:Karl E. Case, Ray C. Fair, Sharon E. OsterPublisher:PEARSON
 Engineering Economy (17th Edition)EconomicsISBN:9780134870069Author:William G. Sullivan, Elin M. Wicks, C. Patrick KoellingPublisher:PEARSON
 Principles of Economics (MindTap Course List)EconomicsISBN:9781305585126Author:N. Gregory MankiwPublisher:Cengage Learning
 Managerial Economics: A Problem Solving ApproachEconomicsISBN:9781337106665Author:Luke M. Froeb, Brian T. McCann, Michael R. Ward, Mike ShorPublisher:Cengage Learning
 Managerial Economics & Business Strategy (Mcgraw-...EconomicsISBN:9781259290619Author:Michael Baye, Jeff PrincePublisher:McGraw-Hill Education
Principles of Economics (12th Edition)
Economics
ISBN:9780134078779
Author:Karl E. Case, Ray C. Fair, Sharon E. Oster
Publisher:PEARSON
Engineering Economy (17th Edition)
Economics
ISBN:9780134870069
Author:William G. Sullivan, Elin M. Wicks, C. Patrick Koelling
Publisher:PEARSON
Principles of Economics (MindTap Course List)
Economics
ISBN:9781305585126
Author:N. Gregory Mankiw
Publisher:Cengage Learning
Managerial Economics: A Problem Solving Approach
Economics
ISBN:9781337106665
Author:Luke M. Froeb, Brian T. McCann, Michael R. Ward, Mike Shor
Publisher:Cengage Learning
Managerial Economics & Business Strategy (Mcgraw-...
Economics
ISBN:9781259290619
Author:Michael Baye, Jeff Prince
Publisher:McGraw-Hill Education