
MATLAB: An Introduction with Applications
6th Edition
ISBN: 9781119256830
Author: Amos Gilat
Publisher: John Wiley & Sons Inc
expand_more
expand_more
format_list_bulleted
Related questions
Question
2b) • Using a Graphing calculator or spreadsheet program, create the least squares regression line of the
• By looking at the scatterplot and the least squares regression line, determine the college that you believe is the best value. Explain your reasoning.
• Using the college (Harvard University) you chose, identify and interpret its residual based on the least squares regression model.
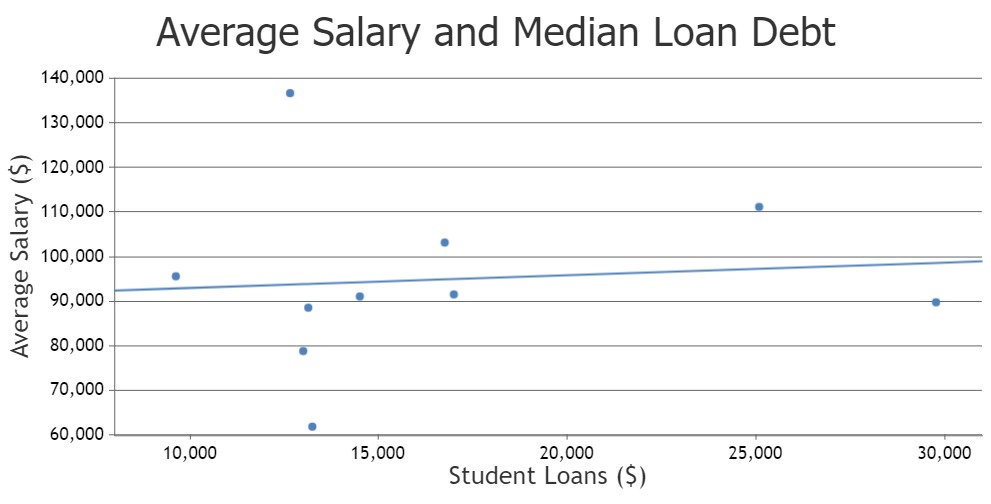

Transcribed Image Text:Average Salary ($)
140,000
130,000
120,000
110,000
100,000
90,000
80,000
70,000
60,000
Average Salary and Median Loan Debt
10,000
15,000
●
20,000
Student Loans ($)
25,000
30,000

Transcribed Image Text:College Name:
Harvard University
Princeton University
Yale University
Current Yearly
Tuition:
$55,587
$56,010
$59,950
Columbia University
$63,530
Cornell University
$61,015
Brown University
$62,304
Dartmouth College
$60,870
University of Pennsylvania $61,710
SUNY Buffalo
Massachusetts Institute of $55,878
Technology
$10,782 (In-state)
Tuition (4 years
total):
$222,348
$224,040
$239,800
$254,120
$244,060
$249,216
$243,480
$246,840
$223,512
$43,128 (In-state)
Median Student
Loan Debt for
Graduates:
$12,665
$9,623
$13,142
$29,757
$14,500
$13,000
$17,000
$16,763
$25,080
$13,254
Average Salary After 10
Years:
$136,700
$95,689
$88,655
$89,871
$91,176
$78,943
$91,627
$103,246
$111,222
$62,022
Expert Solution
This question has been solved!
Explore an expertly crafted, step-by-step solution for a thorough understanding of key concepts.

This is a popular solution

Trending nowThis is a popular solution!

Step by stepSolved in 6 steps with 2 images

Knowledge Booster

Similar questions
- Draw a scatter diagram for the data. Plot the least-squares line on your scatter diagram.arrow_forwardHelp please!arrow_forwardBox office totals:  The data is the 50 highest grossing films(as of 2021.) Box office totals are measured in billions of dollars. -create a scatter plot with the explanatory variable be the Year and response the Revenue (in billions). Make sure to make a copy of the scatterplot in the word document.  -find the equation of the least square's regression line.  -interpret the correlation coefficient, and coefficient of determination (One sentence each) -Is year a good predictor of the box office revenue? Give a 1 to 2 sentence reason why you think so or not?arrow_forward
- You do a survey where you ask people both their age and their income. You want to see if there is a relationship between these two variables, and you want to create an equation you can use to predict someone’s age from his/her income. What kind of hypothesis test or analysis should you do?a. One-Factor, Independent-Measures ANOVAb. Two-Factor ANOVAc. Correlation/Regressiond. Chi-Square Goodness of Fitarrow_forwarduse the sample data to construct a scatterplot. Use the first variable for the x-axis. Based on the scatterplot, what do you conclude about a linear correlation? FORECAST AND ACTUAL TEMPERATURES The table lists actual high temperatures and the high temperatures that were previously forecasted for these same days. The table includes data for ten different days near the author’s home. What does the result suggest about the accuracy of five-day predicted high temperatures?arrow_forwardExplain what are the least-squares line and Regression?arrow_forward
- Using the line of best fit, which equation most closely represents the set of data? { (-5, 8.2), (-3, 14.5), (0, 23.1), (2, 29.7), (6, 40.2), (10, 53.8), (13, 64.4) }arrow_forwardyear- 2000,2005,2010,2014,2019 tuition-$1242,$1809,$2680,$3356,$5132 what is the equation for the least squares regression line? what will tuitions be for the year 2025? when will tuitions be $6500?arrow_forwardWe expect a car's highway gas mileage to be related to its city gas mileage (in miles per gallon, mpg). Data for all 1259 vehicles in the government's 2019 Fuel Economy Guide give the regression line highway mpg = 8.720 + (0.914x city mpg) for predicting highway mileage from city mileage. 1 O Macmillan Learning (b) What is the intercept? Give your answer to three decimal places. intercept: Why is the value of the intercept not statistically meaningful? The value of the intercept is an average value calculated from a sample. The value of the intercept represents the predicted highway mileage for city gas mileage of 0 mpg, and such a prediction would be invalid since 0 is outside the range of the data. The value of the intercept represents the predicted highway mileage for slope 0. O The value of the intercept represents the predicted city mileage for highway gas mileage of 0 mpg, and such a car does not exist. mpgarrow_forward
- solve correctly. I will rate accordingly. please explain your choce.arrow_forwardPlease help it’s not gradedarrow_forwardLet x be the average number of employees in a group health insurance plan, and let y be the average administrative cost as a percentage of claims. x 3 7 15 32 75 y 40 35 30 26 18 (a) Make a scatter diagram of the data and visualize the line you think best fits the data. Flash Player version 10 or higher is required for this question. You can get Flash Player free from Adobe's website. (b) Would you say the correlation is low, moderate, or strong? positive or negative? strong and negative moderate and negative strong and positive low and negative low and positive moderate and positive (c) Use a calculator to verify that Σx = 132, Σx2 = 6932, Σy = 149, Σy2 = 4725, and Σxy = 2997. Compute r. (Round your answer to three decimal places.)r = As x increases, does the value of r imply that y should tend to increase or decrease? Explain. Given our value of r, we cannot draw any conclusions for the behavior of y as x increases. Given our value of r, y should tend to…arrow_forward
arrow_back_ios
SEE MORE QUESTIONS
arrow_forward_ios
Recommended textbooks for you
- MATLAB: An Introduction with ApplicationsStatisticsISBN:9781119256830Author:Amos GilatPublisher:John Wiley & Sons Inc
 Probability and Statistics for Engineering and th...StatisticsISBN:9781305251809Author:Jay L. DevorePublisher:Cengage Learning
 Statistics for The Behavioral Sciences (MindTap C...StatisticsISBN:9781305504912Author:Frederick J Gravetter, Larry B. WallnauPublisher:Cengage Learning
  Elementary Statistics: Picturing the World (7th E...StatisticsISBN:9780134683416Author:Ron Larson, Betsy FarberPublisher:PEARSON
 The Basic Practice of StatisticsStatisticsISBN:9781319042578Author:David S. Moore, William I. Notz, Michael A. FlignerPublisher:W. H. Freeman
 Introduction to the Practice of StatisticsStatisticsISBN:9781319013387Author:David S. Moore, George P. McCabe, Bruce A. CraigPublisher:W. H. Freeman
MATLAB: An Introduction with Applications
Statistics
ISBN:9781119256830
Author:Amos Gilat
Publisher:John Wiley & Sons Inc
Probability and Statistics for Engineering and th...
Statistics
ISBN:9781305251809
Author:Jay L. Devore
Publisher:Cengage Learning
Statistics for The Behavioral Sciences (MindTap C...
Statistics
ISBN:9781305504912
Author:Frederick J Gravetter, Larry B. Wallnau
Publisher:Cengage Learning
Elementary Statistics: Picturing the World (7th E...
Statistics
ISBN:9780134683416
Author:Ron Larson, Betsy Farber
Publisher:PEARSON
The Basic Practice of Statistics
Statistics
ISBN:9781319042578
Author:David S. Moore, William I. Notz, Michael A. Fligner
Publisher:W. H. Freeman
Introduction to the Practice of Statistics
Statistics
ISBN:9781319013387
Author:David S. Moore, George P. McCabe, Bruce A. Craig
Publisher:W. H. Freeman