
A First Course in Probability (10th Edition)
10th Edition
ISBN: 9780134753119
Author: Sheldon Ross
Publisher: PEARSON
expand_more
expand_more
format_list_bulleted
Related questions
Question

Transcribed Image Text:T/275T: Statistics X
ST_56598163/chapter/5/section/5
zy Section 5.5-QNT/275T: Statistics X
tics for Decision Making home >
fference between two population proportions
92.qx3zqy7
Start
B1081295
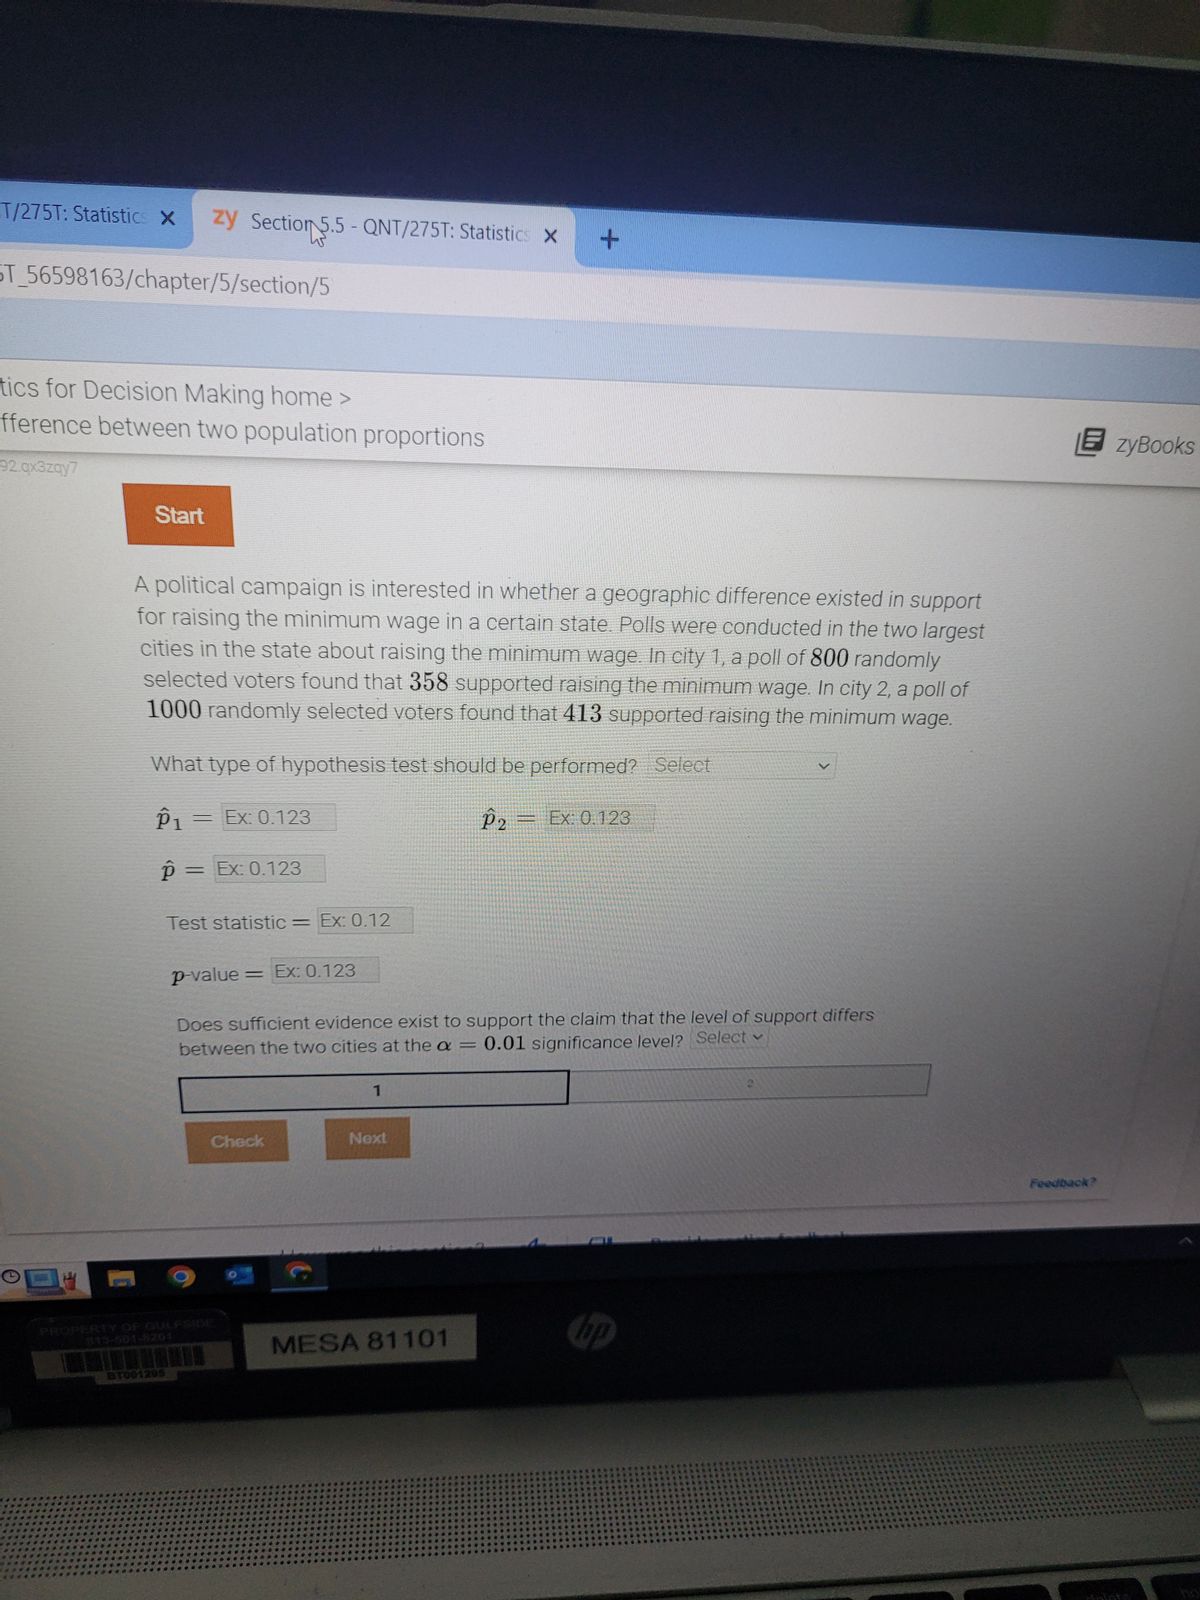
A political campaign is interested in whether a geographic difference existed in support
for raising the minimum wage in a certain state. Polls were conducted in the two largest
cities in the state about raising the minimum wage. In city 1, a poll of 800 randomly
selected voters found that 358 supported raising the minimum wage. In city 2, a poll of
1000 randomly selected voters found that 413 supported raising the minimum wage.
What type of hypothesis test should be performed? Select
P₁ = Ex: 0.123
p = Ex: 0.123
Test statistic = Ex: 0.12
p-value = Ex: 0.123
Check
1
Does sufficient evidence exist to support the claim that the level of support differs
between the two cities at the a = 0.01 significance level? Select ✓
Next
+
P2
MESA 81101
Ex: 0.123
hp
EzyBooks
Feedback?
Expert Solution
This question has been solved!
Explore an expertly crafted, step-by-step solution for a thorough understanding of key concepts.

This is a popular solution

Trending nowThis is a popular solution!

Step by stepSolved in 6 steps with 9 images

Knowledge Booster

Similar questions
- 5. A psychologist want to determine effect from consumption alcohol to ability type from group secretary . Two factor considered , namely : the number of consumption alcohol (0, 1, and 2 ounces ) and type articles ( technical , non- technical ). group of 12 secretaries who have ability similar in type by random chosen with level / level of consumption and type article . Every secretary instructed_ for type one sheet page ( technical or non-technical ). Amount error type created by each_ Secretary noted with results as follows . Type of manuscript Alcoholic Consumption (ounces) Technical Nontechnical 5 3 2 1 12 3 14 6 18 10 21 7 At level significance of 0.01, do the test: a) Is there is effect because level consumption alcohol ? b) Is there is effect because type articles ?? c) Is there is interaction Among consumption alcohol and types article ?arrow_forwardb) what is the correcr DF? option: 979, 973, 940, 934 c) which predictor is the most significan variable? option: smoke, height, age, gestation, weight, first_pregnancy d) which predictor is the least significan variable? option: smoke, height, age, gestation, weight, first_pregnancyarrow_forwardcation.wiley.com/was/ui/v2/assessment-player/index.html?launchld%3D23444A65-4cc0-4df8-ble1-88275c2bf7cd#/guestion/2 rk updated Question 3 of 9 -/1 三 View Policies Current Attempt in Progress Who Is More Trusting: Internet Users or Non-users? In a randomly selected sample of 2237 US adults, 1754 identified themselves as people who use the Internet regularly while the other 483 indicated that they do not use the Internet regularly. In addition to Internet use, participants were asked if they agree with the statement "most people can be trusted." The results show that 807 of the Internet users agree with this statement, while 130 of the non-users agree." Find a 99% confidence interval for the difference in the two proportions, p, - PN,where p, is the proportion for the internet users who agree with the statement and py is the proportion for the non-internet users who agree with the statement. Round youranswers to three decimal places. The 99% confidence interval is to Hampton, K., Goulet,…arrow_forward
- You are a consultant to EAI and you have received the data on theannual salaries of 2500 managers. Some of these managers have alsoindicated that they have received some training. Conduct theappropriate descriptive analyses and present a report that willenable EAI to understand its operations. The link to the data is: https://drive.google.com/file/d/1KluyxHQdEsVNA38_EWPcEgKUJomm9b67/viewarrow_forwardUniversity -. Home - » Students 8-3 Homework: Chapter 8 (Sections 8... 車 Question 7- 8-3 Homework: Chapte... appendixd.jpg 945 nework: Chapter 8 (Sections 8.4 throug... i Saved Help Save & Exit Subr Check my worl A random sample of 16 pharmacy customers showed the waiting times below (in minutes). 18 23 20 15 24 22 25 17 17 26 11 19 25 23 21 22 Click here for the Excel Data File ped Find a 90 percent confidence interval for µ, assuming that the sample is from a normal population. (Round your standard deviation answer to 4 decimal places and t-value to 3 decimal places. Round your answers to 3 decimal places.) ook The 90% confidence interval to sk int rences ( Prev 7 of 10 Next >arrow_forwarduse the date form the second picture to answer question 3 please help me with question 3arrow_forward
arrow_back_ios
arrow_forward_ios
Recommended textbooks for you
- A First Course in Probability (10th Edition)ProbabilityISBN:9780134753119Author:Sheldon RossPublisher:PEARSON

A First Course in Probability (10th Edition)
Probability
ISBN:9780134753119
Author:Sheldon Ross
Publisher:PEARSON