
MATLAB: An Introduction with Applications
6th Edition
ISBN: 9781119256830
Author: Amos Gilat
Publisher: John Wiley & Sons Inc
expand_more
expand_more
format_list_bulleted
Related questions
Question
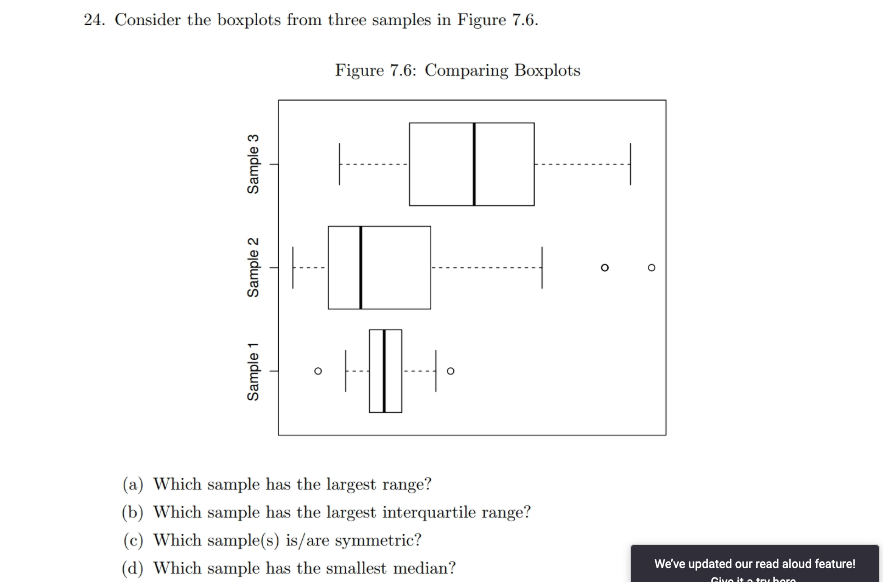

Transcribed Image Text:24. Consider the boxplots from three samples in Figure 7.6.
Figure 7.6: Comparing Boxplots
(a) Which sample has the largest range?
(b) Which sample has the largest interquartile range?
(c) Which sample(s) is/are symmetric?
Sample 1
Sample 2
Sample 3
Expert Solution
This question has been solved!
Explore an expertly crafted, step-by-step solution for a thorough understanding of key concepts.

This is a popular solution

Trending nowThis is a popular solution!

Step by stepSolved in 2 steps with 4 images

Knowledge Booster


Learn more about
Need a deep-dive on the concept behind this application? Look no further. Learn more about this topic, statistics and related others by exploring similar questions and additional content below.Similar questions
- a) what is the median? b) Q3 is 28. Q1 is 12. What should a data value need to be in order to be an outlier?arrow_forwardThe information below is from the small population of 5 students. The 10 possible SRSs of size n = 3 are: Sample #1: Abigail(10), Bobby(5), Carlos(10) Sample #2: Abigail(10), Bobby(5), DeAnna(7) Sample #3: Abigail(10), Bobby(5), Emily(9) Sample #4: Abigail(10), Carlos(10), DeAnna(7) Sample #5: Abigail(10), Carlos(10), Emily(9) Sample #6: Abigail(10), DeAnna(7), Emily(9) Sample #7: Bobby(5), Carlos(10), DeAnna(7) Sample #8: Bobby(5), Carlos(10), Emily (9) Sample #9: Bobby(5), DeAnna(7), Emily(9) Sample #10: Carlos(10), DeAnna(7), Emily(9) Name Abigail Bobby Carlos DeAnna Emily Gender Female Male Male Female Female Quiz score 10 5 10 7 9 Calculate the median quiz score for each sample and display the sampling distribution of the sample median on a dotplot. 011 000000-5 5.5 7.5 T 1.5 1.5 7.5 -2 2 6.5 7 7.5 Median quiz scores 8 9 8.5 Median quiz score 8 8.5 Median quiz score ∞∞∞0-9 2.5 3.5 Median quiz scores 2.5 3 3.5 Median quiz scores -80 4104 8.5 9.5 9.5 4.5 4.5 10 8 10 ∞∞∞∞0-5 00000-5arrow_forward4.A bank has two different customer lines, A and B. Callers dial a single number with 444. Customer service, callers randomly to one of these two lines It directs. In these lines, there is a difference between the lengths of the customers' conversations after connecting to the operator. It is desired to be determined. Random samples of two lines were selected and the following data were obtained. (?? = the last three digits of your student number. If all the last three digits are zero, choose as a three-digit number) A LİNE B LİNESample Size ?1 = 200 ?2=176Sample Average (seconds) 216 195Sample Standard Deviation 35.10 37.80 a.Using the sample statistics, estimate the difference of the two mainstreams within the 95% confidence interval.b.Hypothesis…arrow_forward
- 36.What is the interquartile range of the sample data represented on the stem and leaf diagram below? 0 | 1 3 5 8 8 1 | 3 4 5 2 | 1 14 17.5 20 10.5arrow_forward15.arrow_forward2. It is known that the student score data in a class is as follows: 9, 8, 6, 7, 7, 8, 5, 3, 6, 7 Describe the data in terms of central tendency!arrow_forward
- a) observed value of the test statistic b) the distribution of the test statistic: either X12 , X42 or X22c) p value and if this shows strong evidence for an associationarrow_forwardch 11 end. 5 : The XYZ Corporation is interested in possible differences in days worked by salaried employees in three departments in the financial area. A survey of 23 randomly chosen employees reveals the data shown below. Because of the casual sampling methodology in this survey, the sample sizes are unequal. Research question: Are the mean annual attendance rates the same for employees in these three departments?arrow_forwardThe longest study time by Sarah was_______ hours.arrow_forward
arrow_back_ios
arrow_forward_ios
Recommended textbooks for you
- MATLAB: An Introduction with ApplicationsStatisticsISBN:9781119256830Author:Amos GilatPublisher:John Wiley & Sons Inc
 Probability and Statistics for Engineering and th...StatisticsISBN:9781305251809Author:Jay L. DevorePublisher:Cengage Learning
 Statistics for The Behavioral Sciences (MindTap C...StatisticsISBN:9781305504912Author:Frederick J Gravetter, Larry B. WallnauPublisher:Cengage Learning
  Elementary Statistics: Picturing the World (7th E...StatisticsISBN:9780134683416Author:Ron Larson, Betsy FarberPublisher:PEARSON
 The Basic Practice of StatisticsStatisticsISBN:9781319042578Author:David S. Moore, William I. Notz, Michael A. FlignerPublisher:W. H. Freeman
 Introduction to the Practice of StatisticsStatisticsISBN:9781319013387Author:David S. Moore, George P. McCabe, Bruce A. CraigPublisher:W. H. Freeman
MATLAB: An Introduction with Applications
Statistics
ISBN:9781119256830
Author:Amos Gilat
Publisher:John Wiley & Sons Inc
Probability and Statistics for Engineering and th...
Statistics
ISBN:9781305251809
Author:Jay L. Devore
Publisher:Cengage Learning
Statistics for The Behavioral Sciences (MindTap C...
Statistics
ISBN:9781305504912
Author:Frederick J Gravetter, Larry B. Wallnau
Publisher:Cengage Learning
Elementary Statistics: Picturing the World (7th E...
Statistics
ISBN:9780134683416
Author:Ron Larson, Betsy Farber
Publisher:PEARSON
The Basic Practice of Statistics
Statistics
ISBN:9781319042578
Author:David S. Moore, William I. Notz, Michael A. Fligner
Publisher:W. H. Freeman
Introduction to the Practice of Statistics
Statistics
ISBN:9781319013387
Author:David S. Moore, George P. McCabe, Bruce A. Craig
Publisher:W. H. Freeman