
Advanced Engineering Mathematics
10th Edition
ISBN: 9780470458365
Author: Erwin Kreyszig
Publisher: Wiley, John & Sons, Incorporated
expand_more
expand_more
format_list_bulleted
Related questions
Question
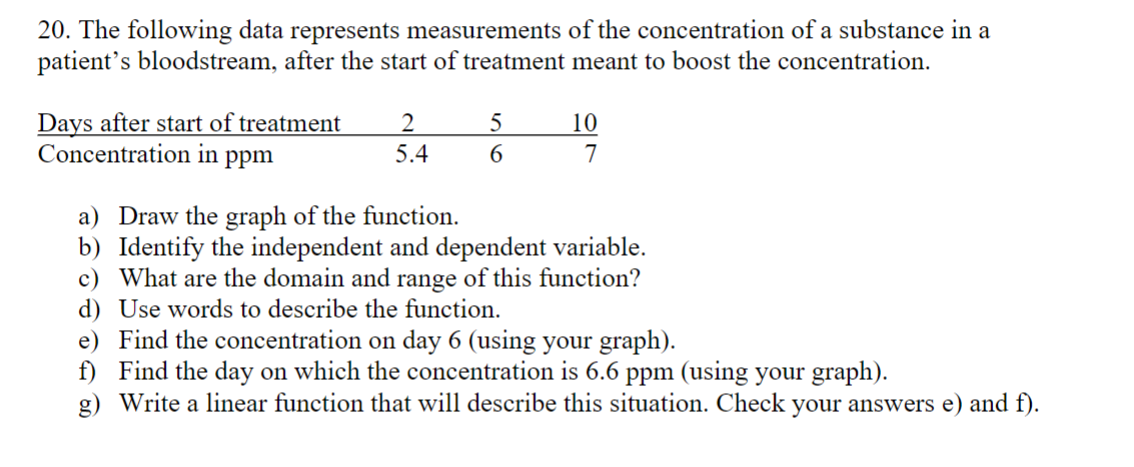

Transcribed Image Text:20. The following data represents measurements of the concentration of a substance in a
patient's bloodstream, after the start of treatment meant to boost the concentration.
Days after start of treatment
Concentration in ppm
2
5.4
5
6
10
7
a) Draw the graph of the function.
b) Identify the independent and dependent variable.
c) What are the domain and range of this function?
d) Use words to describe the function.
e) Find the concentration on day 6 (using your graph).
f) Find the day on which the concentration is 6.6 ppm (using your graph).
g) Write a linear function that will describe this situation. Check your answers e) and f).
Expert Solution
This question has been solved!
Explore an expertly crafted, step-by-step solution for a thorough understanding of key concepts.

This is a popular solution

Trending nowThis is a popular solution!

Step by stepSolved in 3 steps with 1 images

Knowledge Booster

Similar questions
- It is thought that prehistoric Indians did not take their best tools, pottery, and household items when they visited higher elevations for their summer camps. It is hypothesized that archaeological sites tend to lose their cultural identity and specific cultural affiliation as the elevation of the site increases. Let x be the elevation (in thousands of feet) for an archaeological site in the southwestern United States. Let y be the percentage of unidentified artifacts (no specific cultural affiliation) at a given elevation. Suppose that the following data were obtained for a collection of archaeological sites in New Mexico: 6.00 6.50 6.75 7.50 8.50 28 20 17 30 85 Find the value of the coefficient of determination 2. O -0.703 -0.162 0.297 0.703 0.162arrow_forwardWhich of the following is a continuous numerical variable? Select one: a. The amount of milk produced by a cow in one 24-hour period b. The number of gallons of milk sold at the local grocery store yesterday c. The number of employees of an insurance company d. The color of a student's eyesarrow_forwardC. Describe the four characteristics of associationarrow_forward
- 4 5 6 7 Joan is concerned about the amount of energy she uses to heat her home. The graph below plots the mean number of cubic feet of gas per day that Joan used each month against the average temperature for one heating season. NO 40 Temperature (degrees Fahrenheit) Does the plot show a positive or negative association between the variables? Why does this make sense. type your answer.... What is the form of the relationship? Is it strong? Explain. type your answer... Explain what the point at the bottom right represents. type your answer... barrow_forwardIt is thought that prehistoric Indians did not take their best tools, pottery, and household items when they visited higher elevations for their summer camps. It is hypothesized that archaeological sites tend to lose their cultural identity and specific cultural affiliation as the elevation of the site increases. Let x be the elevation (in thousands of feet) for an archaeological site in the southwestern United States. Let y be the percentage of unidentified artifacts (no specific cultural affiliation) at a given elevation. Suppose that the following data were obtained for a collection of archaeological sites in New Mexico: x 5.00 6.00 6.50 7.50 8.00 y 25 55 64 66 75 Find a for the equation of the least-squares line y=a+bx given that x=6.6 and y=57. Group of answer choices –57.039 –41.421 57.039 –56.621 –56.679arrow_forwardIt is thought that prehistoric Indians did not take their best tools, pottery, and household items when they visited higher elevations for their summer camps. It is hypothesized that archaeological sites tend to lose their cultural identity and specific cultural affiliation as the elevation of the site increases. Let x be the elevation (in thousands of feet) for an archaeological site in the southwestern United States. Let y be the percentage of unidentified artifacts (no specific cultural affiliation) at a given elevation. Suppose that the following data were obtained for a collection of archaeological sites in New Mexico:x5.756.257.258.259.25y2218786795What percentage of the variation in y cannot be explained by the corresponding variation in x and the least-squares line?arrow_forward
- bike increases its speed by five meters per second every 10 seconds. Which graph shows this relationship? 501 45 50 45 40 35 30 25 35 A. B. 010 20 30 4050 Time (sec) 10 20 30 4050 Time (sec) 50 10 35 30 D. C. 10 20 30 40 50 Time (sec) 10 20 30 40 50 Time (sec) Snonon onon o n44332211 Speed (m/sec) Speed (m/sec) nttmm2211arrow_forward5.7 x 10 D. 7.8 x 10⁶ 3. The number of tables a banquet hall sets up is a function of the number of guests in at an event. The ordered pairs below represent the number of guests and number of tables at the past four events. What is the domain for the given data? {(65, 9), (125, 15), (195, 25), (84, 11)} A. {65, 195} B. (65, 84, 125, 195) C. (9, 15, 11, 25} D. (9, 15, 11, 25, 65, 84, 125, 195} Name: PRE-ALGEBRA REVIEW 1. Which is most likely the equation of the line graphed? Date: 4. F C C S P n B. 2. Solarrow_forwardThe graph plots the gas mileage of various cars from the same model year versus the weight of these cars in thousands of pounds. Describe the association between the two variables. Also explain what the point at the very top represents. 3.75 Weight (thousands of pounds) BIUA A LE xx, E 12pt Paragraph Submarrow_forward
- Help!!arrow_forwardThe table below shows the relationship between the altitude of the atmosphere and corresponding temperature. Altitude (in feet) 25,000 20,000 15,580 12,902 Temperature (in degree Celsius) 10 16 25 30 What inference can be made from the above data? A.The temperature of the atmosphere decreases with the increase in the altitude. B.The temperature of the atmosphere decreases with the decrease in the altitude. C.The temperature of the atmosphere increases with the increase in the altitude. D.ANo inference can be made from the given data.arrow_forwardIt is thought that prehistoric Indians did not take their best tools, pottery, and household items when they visited higher elevations for their summer camps. It is hypothesized that archaeological sites tend to lose their cultural identity and specific cultural affiliation as the elevation of the site increases. Let x be the elevation (in thousands of feet) for an archaeological site in the southwestern United States. Let y be the percentage of unidentified artifacts (no specific cultural affiliation) at a given elevation. Suppose that the following data were obtained for a collection of archaeological sites in New Mexico: x 5.75 6.75 7.75 8.50 9.25 y 27 16 46 62 95 What percentage of the variation in y cannot be explained by the corresponding variation in x and the least-squares line? Round your answer to the nearest tenth of a percent. 3.4% 18.4% 81.6% 9.7%arrow_forward
arrow_back_ios
arrow_forward_ios
Recommended textbooks for you
- Advanced Engineering MathematicsAdvanced MathISBN:9780470458365Author:Erwin KreyszigPublisher:Wiley, John & Sons, Incorporated
 Numerical Methods for EngineersAdvanced MathISBN:9780073397924Author:Steven C. Chapra Dr., Raymond P. CanalePublisher:McGraw-Hill Education
 Introductory Mathematics for Engineering Applicat...Advanced MathISBN:9781118141809Author:Nathan KlingbeilPublisher:WILEY
  Mathematics For Machine TechnologyAdvanced MathISBN:9781337798310Author:Peterson, John.Publisher:Cengage Learning,

Advanced Engineering Mathematics
Advanced Math
ISBN:9780470458365
Author:Erwin Kreyszig
Publisher:Wiley, John & Sons, Incorporated
Numerical Methods for Engineers
Advanced Math
ISBN:9780073397924
Author:Steven C. Chapra Dr., Raymond P. Canale
Publisher:McGraw-Hill Education
Introductory Mathematics for Engineering Applicat...
Advanced Math
ISBN:9781118141809
Author:Nathan Klingbeil
Publisher:WILEY
Mathematics For Machine Technology
Advanced Math
ISBN:9781337798310
Author:Peterson, John.
Publisher:Cengage Learning,