
Glencoe Algebra 1, Student Edition, 9780079039897, 0079039898, 2018
18th Edition
ISBN: 9780079039897
Author: Carter
Publisher: McGraw Hill
expand_more
expand_more
format_list_bulleted
Related questions
Question
Fast ASAP ASAP asap
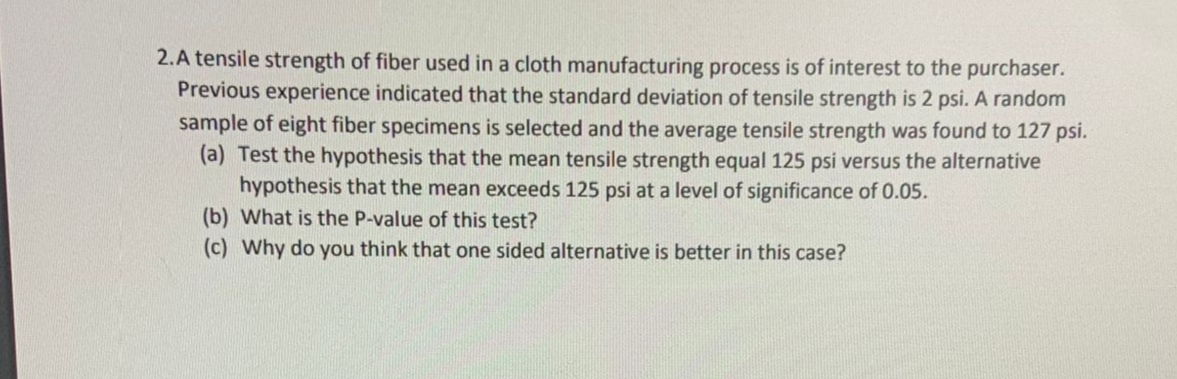

Transcribed Image Text:2.A tensile strength of fiber used in a cloth manufacturing process is of interest to the purchaser.
Previous experience indicated that the standard deviation of tensile strength is 2 psi. A random
sample of eight fiber specimens is selected and the average tensile strength was found to 127 psi.
(a) Test the hypothesis that the mean tensile strength equal 125 psi versus the alternative
hypothesis that the mean exceeds 125 psi at a level of significance of 0.05.
(b) What is the P-value of this test?
(c) Why do you think that one sided alternative is better in this case?
Expert Solution
This question has been solved!
Explore an expertly crafted, step-by-step solution for a thorough understanding of key concepts.

This is a popular solution

Trending nowThis is a popular solution!

Step by stepSolved in 2 steps with 1 images

Knowledge Booster

Similar questions
- A synthetic fiber used in manufacturing carpet has tensile strength that is normally distributed with mean 75.5 psi and standard deviation 3.5 psi. A study is actually conducted with n = 6 and the average value observed is 78.7. Is this surprising? Would it be reasonable to conclude the true mean had changed (that is, it is not really 75.5 for this study)?arrow_forwardThe tensile strength of paper using 5% hardwood and 10% hardwood are to be compared. A random sample of 41 sheets made from 5% hardwood had an average tensile strength of 1.52 lbs. with a standard deviation of 0.33 lbs. A random sample of 61 sheets made from 10% hardwood had an average tensile strength of 1.88 lbs. with a standard deviation of 0.42 lbs. Can we conclude the average tensile strength is the same for the two types of paper? Use 5% significance and p-values. Part 1) Conduct the test using the assumption that the sample standard deviations are the same as the population standard deviations. Part 2) Conduct the test using the assumption that the population standard deviations are unknown but equal (you also must assume a normal population here). Part 3) Conduct the test with only the assumption that we have simple random samples from normal populations. May you please explain which stat test you used on your calculator and why. Thank you very much for your help!arrow_forwardPolymer composite materials have gained popularity because they have high strength to weight ratios and are relatively easy and inexpensive to manufacture. However, their nondegradable nature has prompted development of environmentally friendly composites using natural materials. An article reported that for a sample of 10 specimens with 2% fiber content, the sample mean tensile strength (MPa) was 51.8 and the sample standard deviation was 1.5. Suppose the true average strength for 0% fibers (pure cellulose) is known to be 48 MPa. Does the data provide compelling evidence for concluding that true average strength for the WSF/cellulose composite exceeds this value? (Use a = 0.05.) n USE SALT State the appropriate hypotheses. Ho:H = 48 Ha:µ > 48 = 48 Hạ: u + 48 Ho: H = 48 Hai u 48 H: µ = 48 Calculate the test statistic and determine the P-value. (Round your test statistic to two decimal places and your P-value to three decimal places.) t = P-value = What can you conclude? O The data…arrow_forward
- The mean score in miss smiths 4th grade class was 76, with a standard deviation of 7. Assume the grades are normally distributed and use the empirical rule to find the approximate percentage of students who scored above 83.arrow_forwardPolymer composite materials have gained popularity because they have high strength to weight ratios and are relatively easy and inexpensive to manufacture. However, their nondegradable nature has prompted development of environmentally friendly composites using natural materials. An article reported that for a sample of 10 specimens with 2% fiber content, the sample mean tensile strength (MPa) was 51.4 and the sample standard deviation was 1.2. Suppose the true average strength for 0% fibers (pure cellulose) is known to be 48 MPa. Does the data provide compelling evidence for concluding that true average strength for the WSF/cellulose composite exceeds this value? (Use a = 0.05.) State the appropriate hypotheses. O H,: H 48 H:u = 48 O H,: = 48 Hi u 48 OH:= 48 H: u + 48 Calculate the test statistic and determine the P-value. (Round your test statistic to two decimal places and your P-value to three decimal places.) P-value = What can you conclude? O The data provides compelling…arrow_forwardPolymer composite materials have gained popularity because they have high strength to weight ratios and are relatively easy and inexpensive to manufacture. However, their nondegradable nature has prompted development of environmentally friendly composites using natural materials. An article reported that for a sample of 10 specimens with 2% fiber content, the sample mean tensile strength (MPa) was 51.3 and the sample standard deviation was 1.4. Suppose the true average strength for 0% fibers (pure cellulose) is known to be 48 MPa. Does the data provide compelling evidence for concluding that true average strength for the WSF/cellulose composite exceeds this value? (Use α = 0.05.) State the appropriate hypotheses. ⒸH₂: μ = 48 Ha: > 48 Ho:μ = 48 H₂H 48 H₂: μ = 48 Ho: μ< 48 H₂₁:μ = 48 USE SALT Ho: M = 48 H₂:48 Calculate the test statistic and determine the P-value. (Round your test statistic to two decimal places and your P-value to three decimal places.) t= 7.68 X P-value =arrow_forward
- Polymer composite materials have gained popularity because they have high strength to weight ratios and are relatively easy and inexpensive to manufacture. However, their nondegradable nature has prompted development of environmentally friendly composites using natural materials. An article reported that for a sample of 10 specimens with 2% fiber content, the sample mean tensile strength (MPa) was 51.4 and the sample standard deviation was 1.5. Suppose the true average strength for 0% fibers (pure cellulose) is known to be 48 MPa. Does the data provide compelling evidence for concluding that true average strength for the WSF/cellulose composite exceeds this value? (Use α = 0.05.) Calculate the test statistic and determine the P-value. (Round your test statistic to two decimal places and your P-value to three decimal places.) t = P-value =arrow_forwardPolymer composite materials have gained popularity because they have high strength to weight ratios and are relatively easy and inexpensive to manufacture. However, their nondegradable nature has prompted development of environmentally friendly composites using natural materials. An article reported that for a sample of 10 specimens with 2% fiber content, the sample mean tensile strength (MPa) was 51.1 and the sample standard deviation was 1.3. Suppose the true average strength for 0% fibers (pure cellulose) is known to be 48 MPa. Does the data provide compelling evidence for concluding that true average strength for the WSF/cellulose composite exceeds this value? (Use α = 0.05.) USE SALT State the appropriate hypotheses. ⒸHO: μ> 48 H₂: μ = 48 Ho: μ 48 Ho: μ = 48 H₂: μ = 48 Calculate the test statistic and determine the P-value. (Round your test statistic to two decimal places and your P-value to three decimal places.) t = P-value = What can you conclude? O The data provides compelling…arrow_forwardSteel used for water pipelines is often coated on the inside with cement mortar to prevent corrosion. In a study of the mortar coatings of the pipeline used in a water transmission project in California, researchers noted that the mortar thickness was specified to be 7/16 inch. A very large sample of thickness measurements produced a mean equal to 0.635 inch and a standard deviation equal to 0.082 inch. If the thickness measurements were normally distributed, approximately what proportion were less than 7/16 inch?arrow_forward
- The average American consumes 95 liters of alcohol per year. Does the average college student consume less alcohol per year? A researcher surveyed 13 randomly selected college students and found that they averaged 86.3 liters of alcohol consumed per year with a standard deviation of 24 liters. What can be concluded at the the αα = 0.10 level of significance? For this study, we should use Select an answer z-test for a population proportion t-test for a population mean The null and alternative hypotheses would be: H0:H0: ? p μ Select an answer ≠ > < = H1:H1: ? μ p Select an answer < > ≠ = The test statistic ? z t = (please show your answer to 2 decimal places.) The p-value = (Please show your answer to 4 decimal places.)arrow_forwardCans of LaCroix are supposed to contain 355 milliliters (ml). There is some variation for each can because the filling machinery is not perfectly precise. An inspector measures the contents (in ml) of 12 randomly selected cans from a single day's production. x = 352.9 Sx=2.19 Do these data provide convincing evidence at the a = 0.01 significance level that the mean amount of LaCroix in all the cans filled that day is less than the target value of 355 ml? (6pt) STATE: State hypotheses, parameters), significance level, and evidence for Ha Parameter: Statistic: Hypotheses: Significance level: Evidence for Ha: (mean less than sample) (2pt) PLAN: Identify the appropriate inference method and check conditions. Name of procedure: Check conditions: Random Sample: Normal / Large Sample: Describe what is shown.arrow_forwardThe nicotine content in cigarettes of a certain brand is normally distributed with mean (in milligrams) u. The brand advertises that the mean nicotine content of their cigarettes is 1.5, but measurements on a random sample of 100 cigarettes of this brand gave a mean of = 1.53 and standard 1. deviation s = 0.1. Is there sufficient evidence in the sample to suggest that the mean nicotine content is actually higher than advertised? Use a = 0.01. (a) Set the appropriate hypotheses for the question. (b) Find the value of the standardized test statistic. (c) Find the rejection region. (d) What is your decision? (e) Find the p-value of this test.arrow_forward
arrow_back_ios
SEE MORE QUESTIONS
arrow_forward_ios
Recommended textbooks for you
- Glencoe Algebra 1, Student Edition, 9780079039897...AlgebraISBN:9780079039897Author:CarterPublisher:McGraw Hill
Glencoe Algebra 1, Student Edition, 9780079039897...
Algebra
ISBN:9780079039897
Author:Carter
Publisher:McGraw Hill