MATLAB: An Introduction with Applications
6th Edition
ISBN: 9781119256830
Author: Amos Gilat
Publisher: John Wiley & Sons Inc
expand_more
expand_more
format_list_bulleted
Question
thumb_up100%
I need help with my homework! How do I complete each question?

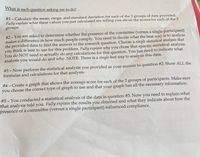
Transcribed Image Text:What is each question asking me to do?
#1 - Calculate the mean, range, and standard deviation for each of the 2 groups of data provided.
Fully explain what these values you just calculated are telling you about the scores for each of the 2
groups.
#2 - You are asked to determine whether the presence of the committee (versus a single participant)
makes a difference in how much people comply. You need to decide what the best way is to analyze
the provided data to find the answer to the research question. Choose a single statistical analysis that
think is best to use for this problem. Fully explain why you chose that specific statistical analysis.
you
You do NOT need to actually do any calculations for this question. You just need to indicate what
analysis you would do and why. NOTE: There is a single best way to analyze this data.
#3 - Now perform the statistical analysis you provided as your answer to question #2. Show ALL the
formulas and calculations for that analysis.
#4 - Create a graph that shows the average score for each of the 2 groups of participants. Make sure
you choose the correct type of graph to use and that your graph has all the necessary information.
#5 – You conducted a statistical analysis of the data in question #3. Now you need to explain what
that analysis told you. Fully explain the results you obtained and what they indicate about how the
presence of a committee (versus a single participant) influenced compliance.

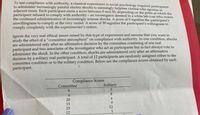
Transcribed Image Text:To test compliance with authority, a classical experiment in social psychology required participants
to administer increasingly painful electric shocks to seemingly helpless victims who agonize in
adjacent room. Each participant earns a score between 0 and 30, depending on the point at which the
participant refused to comply with authority - an investigator dressed in a white lab coat who orders
the continued administration of increasingly intense shocks. A score of 0 signifies the participant's
unwillingness to comply at the very outset. A score of 30 signifies the participants willingness to
comply completely with the experimenter's orders.
Ignore the very real ethical issues raised by this type of experiment and assume that you want to
study the effect of a "committee atmosphere" on compliance with authority. In one condition, shocks
are administered only after an affirmative decision by the committee consisting of one real
participant and two associates of the investigator who act as participants but in fact always vote to
administer the shock. In the other condition, shocks are administered only after an affirmative
decision by a solitary real participant. A total of 12 participants are randomly assigned either to the
committee condition or to the solitary condition. Below are the compliance scores obtained by each
participant.
Compliance Scores
Committee
Solitary
9.
6.
8.
20
4
15
9.
23
12
12
1
* Calculabe
these
1. Determine basic descriptive statistics (mean, standard deviation, range) for each group and
explain what these statistics tell you about the overall performance of the two groups. Explain
in complete sentences using terms a person with limited skills and understanding of basic
math or statistics could understand.
Pearson concletioA
*Name test you will use then wite the
formule
2. Your research question is to explore whether the two groups differ in compliance to authority.
Briefly describe the appropriate statistical strategy and mathematical expressions (i.e.,
formulas) necessary for addressing this problem. Explain in detail your rationale for
choice of strategy.
your
*Compute tobt, tont, and degrees
of fredom
3. Perform the statistical analysis you described in item 2.
4. Graph the mean performance of the two groups on graph paper.
5. Explain and defend your conclusions in response to your research question. Explain in
complete sentences in terms a person with limited skills and understanding of basic math or
statistics could understand.
Expert Solution
This question has been solved!
Explore an expertly crafted, step-by-step solution for a thorough understanding of key concepts.
This is a popular solution
Trending nowThis is a popular solution!
Step by stepSolved in 3 steps with 9 images

Follow-up Questions
Read through expert solutions to related follow-up questions below.
Follow-up Question
What statistical strategy can I use for analyzing this research question and how will it be performed?

Transcribed Image Text:2. Your research question is to explore whether the two groups differ in compliance to authority.
Briefly describe the appropriate statistical strategy and mathematical expressions (i.e.,
formulas) necessary for addressing this problem. Explain in detail your rationale for your
choice of strategy.
Compute tobt, tont, and degrees
of fredom
3. Perform the statistical analysis you described in item 2.

Transcribed Image Text:To test compliance with authority, a classical experiment in social psychology required participants
to administer increasingly painful electric shocks to seemingly helpless victims who agonize in
adjacent room. Each participant earns a score between 0 and 30, depending on the point at which the
participant refused to comply with authority - an investigator dressed in a white lab coat who orders
the continued administration of increasingly intense shocks. A score of 0 signifies the participant's
unwillingness to comply at the very outset. A score of 30 signifies the participanťs willingness to
comply completely with the experimenter's orders.
Ignore the very real ethical issues raised by this type of experiment and assume that you want to
study the effect of a "committee atmosphere" on compliance with authority. In one condition, shocks
are administered only after an affirmative decision by the committee consisting of one real
participant and two associates of the investigator who act as participants but in fact always vote to
administer the shock. In the other condition, shocks are administered only after an affirmative
decision by a solitary real participant. A total of 12 participants are randomly assigned either to the
committee condition or to the solitary condition. Below are the compliance scores obtained by each
participant.
Compliance Scores
Solitary
3
Committee
6.
8.
4.
20
15
23
6.
12
1.
12
Solution
by Bartleby Expert
Follow-up Questions
Read through expert solutions to related follow-up questions below.
Follow-up Question
What statistical strategy can I use for analyzing this research question and how will it be performed?

Transcribed Image Text:2. Your research question is to explore whether the two groups differ in compliance to authority.
Briefly describe the appropriate statistical strategy and mathematical expressions (i.e.,
formulas) necessary for addressing this problem. Explain in detail your rationale for your
choice of strategy.
Compute tobt, tont, and degrees
of fredom
3. Perform the statistical analysis you described in item 2.

Transcribed Image Text:To test compliance with authority, a classical experiment in social psychology required participants
to administer increasingly painful electric shocks to seemingly helpless victims who agonize in
adjacent room. Each participant earns a score between 0 and 30, depending on the point at which the
participant refused to comply with authority - an investigator dressed in a white lab coat who orders
the continued administration of increasingly intense shocks. A score of 0 signifies the participant's
unwillingness to comply at the very outset. A score of 30 signifies the participanťs willingness to
comply completely with the experimenter's orders.
Ignore the very real ethical issues raised by this type of experiment and assume that you want to
study the effect of a "committee atmosphere" on compliance with authority. In one condition, shocks
are administered only after an affirmative decision by the committee consisting of one real
participant and two associates of the investigator who act as participants but in fact always vote to
administer the shock. In the other condition, shocks are administered only after an affirmative
decision by a solitary real participant. A total of 12 participants are randomly assigned either to the
committee condition or to the solitary condition. Below are the compliance scores obtained by each
participant.
Compliance Scores
Solitary
3
Committee
6.
8.
4.
20
15
23
6.
12
1.
12
Solution
by Bartleby Expert
Knowledge Booster
Similar questions
arrow_back_ios
arrow_forward_ios
Recommended textbooks for you
 MATLAB: An Introduction with ApplicationsStatisticsISBN:9781119256830Author:Amos GilatPublisher:John Wiley & Sons Inc
 Probability and Statistics for Engineering and th...StatisticsISBN:9781305251809Author:Jay L. DevorePublisher:Cengage Learning
 Statistics for The Behavioral Sciences (MindTap C...StatisticsISBN:9781305504912Author:Frederick J Gravetter, Larry B. WallnauPublisher:Cengage Learning
 Elementary Statistics: Picturing the World (7th E...StatisticsISBN:9780134683416Author:Ron Larson, Betsy FarberPublisher:PEARSON
 The Basic Practice of StatisticsStatisticsISBN:9781319042578Author:David S. Moore, William I. Notz, Michael A. FlignerPublisher:W. H. Freeman
 Introduction to the Practice of StatisticsStatisticsISBN:9781319013387Author:David S. Moore, George P. McCabe, Bruce A. CraigPublisher:W. H. Freeman

MATLAB: An Introduction with Applications
Statistics
ISBN:9781119256830
Author:Amos Gilat
Publisher:John Wiley & Sons Inc

Probability and Statistics for Engineering and th...
Statistics
ISBN:9781305251809
Author:Jay L. Devore
Publisher:Cengage Learning

Statistics for The Behavioral Sciences (MindTap C...
Statistics
ISBN:9781305504912
Author:Frederick J Gravetter, Larry B. Wallnau
Publisher:Cengage Learning

Elementary Statistics: Picturing the World (7th E...
Statistics
ISBN:9780134683416
Author:Ron Larson, Betsy Farber
Publisher:PEARSON

The Basic Practice of Statistics
Statistics
ISBN:9781319042578
Author:David S. Moore, William I. Notz, Michael A. Fligner
Publisher:W. H. Freeman

Introduction to the Practice of Statistics
Statistics
ISBN:9781319013387
Author:David S. Moore, George P. McCabe, Bruce A. Craig
Publisher:W. H. Freeman