MATLAB: An Introduction with Applications
6th Edition
ISBN: 9781119256830
Author: Amos Gilat
Publisher: John Wiley & Sons Inc
expand_more
expand_more
format_list_bulleted
Question

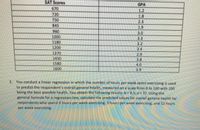
Transcribed Image Text:SAT Scores
GPA
670
720
750
845
1.2
1.8
2,3
1.9
960
3.0
1000
3.3
1180
3.2
3.4
1200
1370
1450
1580
1600
2.9
3.8
14.0
3,9
2. You conduct a linear regression in which the number of hours per week spent exercising is used
to predict the respondent's overall general health, measured on a scale from 0 to 100 with 100
being the best possible health. You obtain the following results: b = 4,5; a = 37. Using the
general formula for a regression line, calculate the predicted values for overall general health for
respondents who spend 0 hours per week exercising,3 hours per week exercising, and 12 hours
per week exercising.
Expert Solution
This question has been solved!
Explore an expertly crafted, step-by-step solution for a thorough understanding of key concepts.
This is a popular solution
Trending nowThis is a popular solution!
Step by stepSolved in 2 steps

Knowledge Booster
Similar questions
- The following table shows the reported net sales by Nokia in 2008, 2009, and 2010. Year 2008 2009 2010x 0 1 2Sales ($ millions) 20 50 60 Find the Equation of the Linear Regression Line. Rounds decimal values to the nearest tenths.arrow_forwardUse the scatterplot of Vehicle Registrations below to answer the questions Vehicle Registrations in the United States, 1925- 2011 Vehicles millions 300 y = 3.0161x - 5819.5 R? = 0.9695 250 200 150 100 50 1920 -50 1940 1960 1980 2000 2020 Year Write a sentence explaining the value of the slope for this regression line. For every increase in year, the number of vehicle registrations in the US increases by 3.0161 million. For every increase in year, the number of vehicle registrations in the US increases by 5819.5. For every increase in vehicle registrations in the US, the number of years increases by 5819.5. For every increase in vehicle registrations in the US, the number of years increases by 3.0161 million. Registrations (in millions)arrow_forwardPa.n.narrow_forward
- 1.arrow_forwardA vocational counselor uses the number of days without employment to predict her clients' feelings of self efficacy, measured on a scale of 1 to 5, with higher numbers meaning that clients feel more secure in their job related abilities. The slope of the regression line is –1.02. Which statement is the best interpretation for this finding? a. For every 1-point increase in self-efficacy, there is an associated decrease in the number of days of unemployment. b. For every additional day of unemployment, there is an associated decrease in self-efficacy of 1.02 points. c. The least number of days a person can be unemployed and still feel self-efficacious is 3.98 points d. The decrease in self-efficacy of 1.02 points is caused by each additional day of unemploymentarrow_forwardConsider the following data set, where y is the final grade in a math class and is the average number of hours the student spent working on math each week. hours/week X 6.5 10 11 12.5 13 14.5 15 17.5 19.5 20 Grade y 66.1 63 71.4 72.5 79.2 94.3 95 91.5 100 98 The regression equation is y = 3x + 41.3. a) Explain what the value of the slope means in this situation, where y is the final grade in a math class and is the average number of hours the student spent working on math each week. O For each additional hour per week that a student studies on average, their final grade will be about 3 points. O For each additional hour per week that a student studies on average, their final grade will be about 41.3 points higher. For each additional hour per week that a student studies on average, their final grade will be about 3 points higher. O For each additional hour per week that a student studies on average, their final grade will be about 41.3 points. b) Explain what the value of the…arrow_forward
arrow_back_ios
arrow_forward_ios
Recommended textbooks for you
 MATLAB: An Introduction with ApplicationsStatisticsISBN:9781119256830Author:Amos GilatPublisher:John Wiley & Sons Inc
 Probability and Statistics for Engineering and th...StatisticsISBN:9781305251809Author:Jay L. DevorePublisher:Cengage Learning
 Statistics for The Behavioral Sciences (MindTap C...StatisticsISBN:9781305504912Author:Frederick J Gravetter, Larry B. WallnauPublisher:Cengage Learning
 Elementary Statistics: Picturing the World (7th E...StatisticsISBN:9780134683416Author:Ron Larson, Betsy FarberPublisher:PEARSON
 The Basic Practice of StatisticsStatisticsISBN:9781319042578Author:David S. Moore, William I. Notz, Michael A. FlignerPublisher:W. H. Freeman
 Introduction to the Practice of StatisticsStatisticsISBN:9781319013387Author:David S. Moore, George P. McCabe, Bruce A. CraigPublisher:W. H. Freeman

MATLAB: An Introduction with Applications
Statistics
ISBN:9781119256830
Author:Amos Gilat
Publisher:John Wiley & Sons Inc

Probability and Statistics for Engineering and th...
Statistics
ISBN:9781305251809
Author:Jay L. Devore
Publisher:Cengage Learning

Statistics for The Behavioral Sciences (MindTap C...
Statistics
ISBN:9781305504912
Author:Frederick J Gravetter, Larry B. Wallnau
Publisher:Cengage Learning

Elementary Statistics: Picturing the World (7th E...
Statistics
ISBN:9780134683416
Author:Ron Larson, Betsy Farber
Publisher:PEARSON

The Basic Practice of Statistics
Statistics
ISBN:9781319042578
Author:David S. Moore, William I. Notz, Michael A. Fligner
Publisher:W. H. Freeman

Introduction to the Practice of Statistics
Statistics
ISBN:9781319013387
Author:David S. Moore, George P. McCabe, Bruce A. Craig
Publisher:W. H. Freeman