
MATLAB: An Introduction with Applications
6th Edition
ISBN: 9781119256830
Author: Amos Gilat
Publisher: John Wiley & Sons Inc
expand_more
expand_more
format_list_bulleted
Related questions
Question
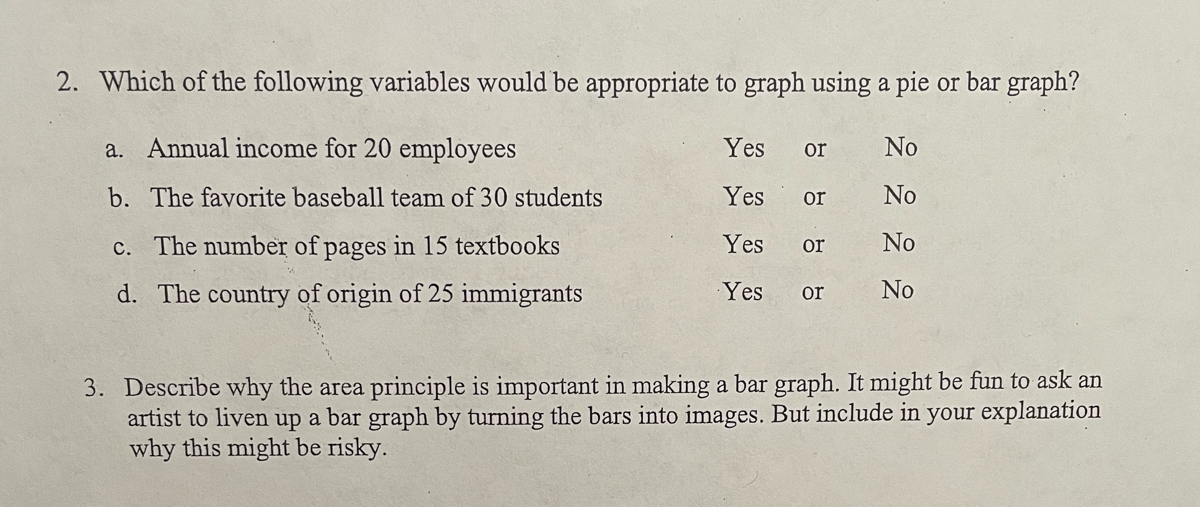

Transcribed Image Text:2. Which of the following variables would be appropriate to graph using a pie or bar graph?
a. Annual income for 20 employees
Yes
No
or
b. The favorite baseball team of 30 students
Yes
or
No
c. The number of pages in 15 textbooks
Yes
No
or
d. The country of origin of 25 immigrants
Yes
No
or
3. Describe why the area principle is important in making a bar graph. It might be fun to ask an
artist to liven up a bar graph by turning the bars into images. But include in your explanation
why this might be risky.
Expert Solution
arrow_forward
Step 1
a) Annual income for 20 employees YES
b) The favorite baseball team of 30 students NO
c) The number of pages in 15 textbooks YES
d) The country of origin of 25 immigrants NO

Trending nowThis is a popular solution!

Step by stepSolved in 2 steps

Knowledge Booster

Similar questions
- The ages of people at a family party are listed. Construct an ordered stem-and-leaf diagram for the given data. Don’t forget to include your rough draft. You may want to do this on graph paper.34 54 17 26 34 25 14 24 25 23 20 18 25 19 27 26 35 36arrow_forward5. Mr. Mike Hunt wants to make an investment in the stock market. He has shortlisted stocks and wants to know the frequency of the prices. So, he created the following table where the number of stocks falling in the particular price categories. a. Represent the data set in a suitable graph with appropriate information (like title, axis, label etc.) and comments on the graph.b. How many stocks Mr. Rahman shortlisted that cost below 1900?c. Which class has the maximum and minimum no. of shares?d. Which class has the second maximum and second minimum no. of shares?arrow_forwardOn its maiden voyage in 1912, the RMS Titanic struck an iceberg and sank in less than three hours. The table shows survival statistics. Survivors Deceased Women and Children 11 Women and Total Category First Class Second Class Third Class Children Men Men 145 54 119 329 285 24 119 142 417 15 104 105 710 69 214 706 685 1517 899 Crew Total 2223 Source: Statistics of Passengers Rescued and Lost, White Star Momentos 1. Create a graph that lawyers could use to help families of the affected passengers. Explain what type of graph you chose and why. 2. The cruise line released a statement with the headline, "Hundreds of Lives Saved in Titanic Mishap." Create a graph or highlight some data that the cruise line could use to justify this headline. 3. Reflect How do the graphs from steps 1 and 2 show that the way in which you represent information can change people's perceptions? 4. Extend Your Understanding Search the Internet for some examples of data displays that are accurate but misrepresent…arrow_forward
- A researcher is interested in exploring the relationship between lengths and weights of low birth weight infants. Using the table in the image attached, create a scatter plot graph, using R, in Jupyterhub. Describe what you see, include the code, and graph.arrow_forwardThe book The Wall Street Journal. Guide to Information Graphics by Dona M. Wong gives strategies for using graphs and charts to display information effectively. One popular graph discussed is the donut pie chart. The donut pie chart is simply a pie chart with the center removed. A recent Harris Poll asked adults about their opinions regarding whether books should be banned from libraries because of social, language, violent, sexual, or religious content. The responses by education level to the question "Do you think that there are any books which should be banned completely?" are shown in the following donut pie charts. (a) What feature of Keith's graph makes it difficult to visually compare the responses of those with some college to those shown in the other graphs? (Select all that apply.) a)The graphs made by Keith and Ramon compare groups across education level. b)The graphs made by Keith and Ramon are all donut pie charts. c)The graphs do not have data labels showing the…arrow_forwardPlease graph the answer (Solve p =, z =, etc)arrow_forward
- 5.arrow_forwardWhat are some of the features of a circle graph? Select all that apply. O Each slice in a circle graph represents a portion of the whole. O A circle graph is effective for presenting trends. O A circle graph is effective when there are many small categories. O A circle graph is effective for comparing categories. O If there are many variables or categories, the smaller ones might not be visible in the graph.arrow_forwardLet x be the price of a new car. Let n be the number of people willing to buy the car at price x. As the price of the car goes from $13,500 to $14,600, fewer people will be willing to buy the car. Sketch a graph that shows the relationship between x and n. Choose the correct graph below. O A. O B. OC. Cars Cars Cars An 小n An 13,000 14,000 Price ($) 15,000 13,000 14,000 15,000 15,000 14,000 Price ($) 13,000 Price ($) Clear All Final Check Help Me Solve This View an Example Get More Help - Review progress Question 2 of 3 + Back ext> Signarrow_forward
arrow_back_ios
arrow_forward_ios
Recommended textbooks for you
- MATLAB: An Introduction with ApplicationsStatisticsISBN:9781119256830Author:Amos GilatPublisher:John Wiley & Sons Inc
 Probability and Statistics for Engineering and th...StatisticsISBN:9781305251809Author:Jay L. DevorePublisher:Cengage Learning
 Statistics for The Behavioral Sciences (MindTap C...StatisticsISBN:9781305504912Author:Frederick J Gravetter, Larry B. WallnauPublisher:Cengage Learning
  Elementary Statistics: Picturing the World (7th E...StatisticsISBN:9780134683416Author:Ron Larson, Betsy FarberPublisher:PEARSON
 The Basic Practice of StatisticsStatisticsISBN:9781319042578Author:David S. Moore, William I. Notz, Michael A. FlignerPublisher:W. H. Freeman
 Introduction to the Practice of StatisticsStatisticsISBN:9781319013387Author:David S. Moore, George P. McCabe, Bruce A. CraigPublisher:W. H. Freeman
MATLAB: An Introduction with Applications
Statistics
ISBN:9781119256830
Author:Amos Gilat
Publisher:John Wiley & Sons Inc
Probability and Statistics for Engineering and th...
Statistics
ISBN:9781305251809
Author:Jay L. Devore
Publisher:Cengage Learning
Statistics for The Behavioral Sciences (MindTap C...
Statistics
ISBN:9781305504912
Author:Frederick J Gravetter, Larry B. Wallnau
Publisher:Cengage Learning
Elementary Statistics: Picturing the World (7th E...
Statistics
ISBN:9780134683416
Author:Ron Larson, Betsy Farber
Publisher:PEARSON
The Basic Practice of Statistics
Statistics
ISBN:9781319042578
Author:David S. Moore, William I. Notz, Michael A. Fligner
Publisher:W. H. Freeman
Introduction to the Practice of Statistics
Statistics
ISBN:9781319013387
Author:David S. Moore, George P. McCabe, Bruce A. Craig
Publisher:W. H. Freeman