
MATLAB: An Introduction with Applications
6th Edition
ISBN: 9781119256830
Author: Amos Gilat
Publisher: John Wiley & Sons Inc
expand_more
expand_more
format_list_bulleted
Related questions
Question
Answer question 3
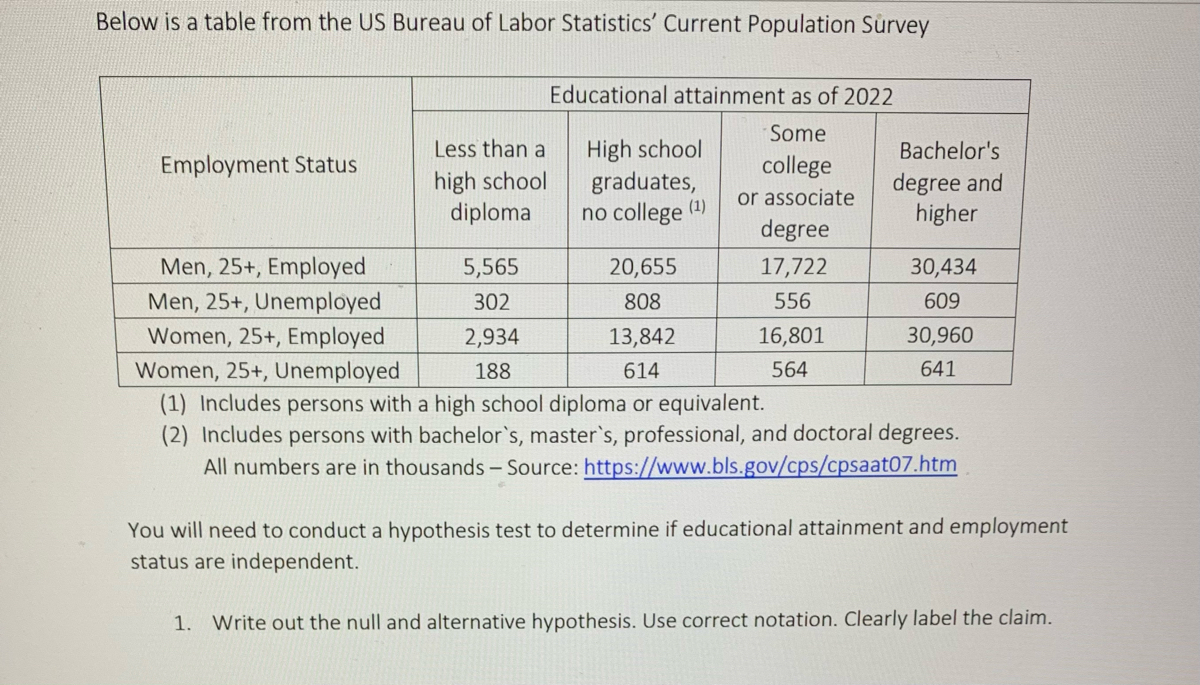

Transcribed Image Text:Below is a table from the US Bureau of Labor Statistics' Current Population Survey
Employment Status
Men, 25+, Employed
Men, 25+, Unemployed
Less than a
high school
diploma
5,565
302
Educational attainment as of 2022
Some
college
or associate
degree
17,722
556
2,934
188
High school
graduates,
no college
20,655
808
(1)
Bachelor's
degree and
higher
Women, 25+, Employed
13,842
Women, 25+, Unemployed
614
(1) Includes persons with a high school diploma or equivalent.
(2) Includes persons with bachelor's, master's, professional, and doctoral degrees.
All numbers are in thousands - Source: https://www.bls.gov/cps/cpsaat07.htm
16,801
564
30,434
609
30,960
641
You will need to conduct a hypothesis test to determine if educational attainment and employment
status are independent.
1. Write out the null and alternative hypothesis. Use correct notation. Clearly label the claim.

Transcribed Image Text:2. What is the test statistic? What is the p-value?
Test Statistic
x squared = 2054.597462
= 2054.597
p-value = 0
I
3. Write out your decision and conclusion using complete sentences. Be sure your answer makes
sense within context of this table.
Expert Solution
This question has been solved!
Explore an expertly crafted, step-by-step solution for a thorough understanding of key concepts.

Step by stepSolved in 3 steps

Knowledge Booster

Similar questions
Recommended textbooks for you
- MATLAB: An Introduction with ApplicationsStatisticsISBN:9781119256830Author:Amos GilatPublisher:John Wiley & Sons Inc
 Probability and Statistics for Engineering and th...StatisticsISBN:9781305251809Author:Jay L. DevorePublisher:Cengage Learning
 Statistics for The Behavioral Sciences (MindTap C...StatisticsISBN:9781305504912Author:Frederick J Gravetter, Larry B. WallnauPublisher:Cengage Learning
  Elementary Statistics: Picturing the World (7th E...StatisticsISBN:9780134683416Author:Ron Larson, Betsy FarberPublisher:PEARSON
 The Basic Practice of StatisticsStatisticsISBN:9781319042578Author:David S. Moore, William I. Notz, Michael A. FlignerPublisher:W. H. Freeman
 Introduction to the Practice of StatisticsStatisticsISBN:9781319013387Author:David S. Moore, George P. McCabe, Bruce A. CraigPublisher:W. H. Freeman
MATLAB: An Introduction with Applications
Statistics
ISBN:9781119256830
Author:Amos Gilat
Publisher:John Wiley & Sons Inc
Probability and Statistics for Engineering and th...
Statistics
ISBN:9781305251809
Author:Jay L. Devore
Publisher:Cengage Learning
Statistics for The Behavioral Sciences (MindTap C...
Statistics
ISBN:9781305504912
Author:Frederick J Gravetter, Larry B. Wallnau
Publisher:Cengage Learning
Elementary Statistics: Picturing the World (7th E...
Statistics
ISBN:9780134683416
Author:Ron Larson, Betsy Farber
Publisher:PEARSON
The Basic Practice of Statistics
Statistics
ISBN:9781319042578
Author:David S. Moore, William I. Notz, Michael A. Fligner
Publisher:W. H. Freeman
Introduction to the Practice of Statistics
Statistics
ISBN:9781319013387
Author:David S. Moore, George P. McCabe, Bruce A. Craig
Publisher:W. H. Freeman