
MATLAB: An Introduction with Applications
6th Edition
ISBN: 9781119256830
Author: Amos Gilat
Publisher: John Wiley & Sons Inc
expand_more
expand_more
format_list_bulleted
Related questions
Question
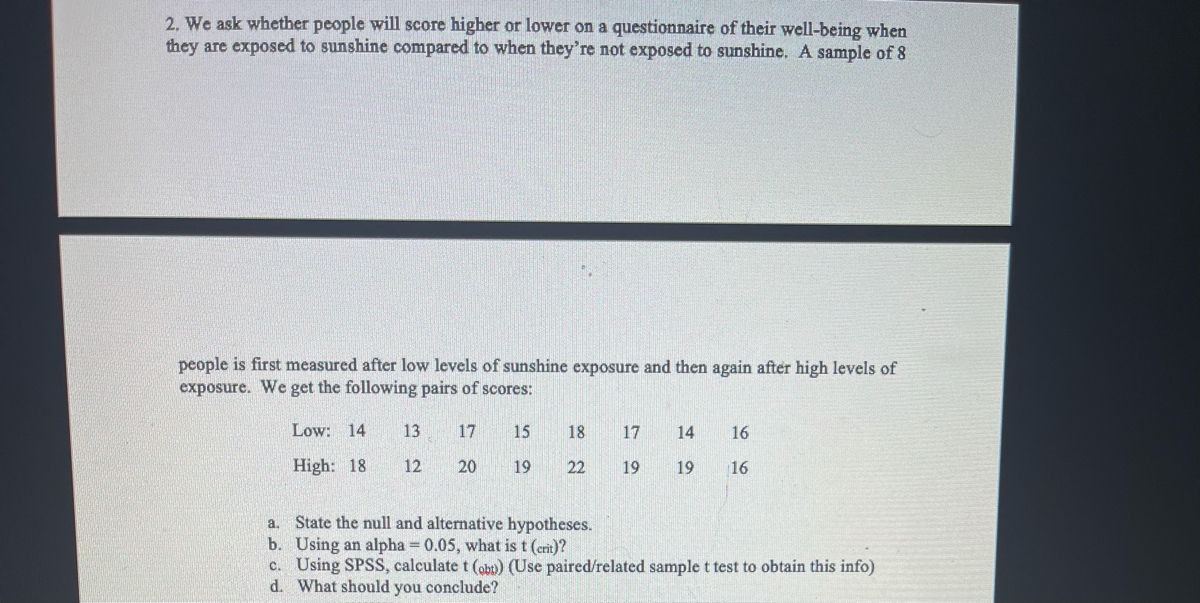

Transcribed Image Text:2. We ask whether people will score higher or lower on a questionnaire of their well-being when
they are exposed to sunshine compared to when they're not exposed to sunshine. A sample of 8
people is first measured after low levels of sunshine exposure and then again after high levels of
exposure. We get the following pairs of scores:
Low: 14
13
17
15
18
17
14
16
High: 18
12
20
19
22
19
19
16
a. State the null and alternative hypotheses.
b. Using an alpha = 0.05, what is t (crit)?
c. Using SPSS, calculate t (obu) (Use paired/related sample t test to obtain this info)
d. What should you conclude?
Expert Solution
This question has been solved!
Explore an expertly crafted, step-by-step solution for a thorough understanding of key concepts.

This is a popular solution

Trending nowThis is a popular solution!

Step by stepSolved in 2 steps with 1 images

Knowledge Booster

Similar questions
- You may need to use the appropriate technology to answer this question. The Wall Street Journal Corporate Perceptions Study 2011 surveyed readers and asked how each rated the quality of management and the reputation of the company for over 250 worldwide corporations. Both the quality of management and the reputation of the company were rated on an excellent, good, and fair categorical scale. Assume the sample data for 200 respondents below applies to this study. Reputation of Company Quality of Management Excellent Good Fair Excellent 40 25 8 Good 35 35 10 Fair 25 10 12 (a) Use a 0.05 level of significance and test for independence of the quality of management and the reputation of the company. State the null and alternative hypotheses. O H: Quality of management is independent of the reputation of the company. H: Quality of management is not independent of the reputation of the company. O H: Quality of management is independent of the reputation of the H: The proportion of companies…arrow_forwardwhen you have means from two different samples, it is best to conduct a what test?arrow_forwardA food services manager for a baseball park wants to know if there is a relationship between gender (male or female) and the preferred condiment on a hot dog. The following table summarizes the results. Test the hypothesis with a significance level of 10%. Gender Condiment Ketchup Mustard Relish Male 15 23 10 Female 25 19 08arrow_forward
- A researcher gathered a sample of participants who volunteered for a studying of phobias. She measured anxiety level of participants as they viewed photos of spiders and again when they viewed puppies. Which statistical test is appropriate for this study and why?arrow_forwardLynn University wants to examine whether students display better academic performance in class versus online. They have collected GPAs of two different samples of students, a sample from classes that take place in-person and a sample from classes that take place online. The data set is below. They predict that in-class students perform better than online students. GPA's In Class GPA Online GPA 4.0 4.0 3.5 2.2 3.7 3.3 3.5 3.7 2.0 2.5 3.2 3.8 3.3 3.8 What type of t-test should we use for this research question? Group of answer choices a) One sample b) Independent samples c) Paired Samplesarrow_forwardGive me an example of a research scenario where you would use an independent samples t-test. You can set up a situation where there is an experimental group and a control group, or maybe you want to compare two other groups of people (parents and non-parents, gender, partnered and single, etc). Give us a summary of what you would want to study, who your sample participants would be, why an independent samples t-test would be the best fit, and what statistically significant results would mean. Don't forget to include your research and null hypotheses!arrow_forward
- Anterior cruciate ligament (ACL) injuries occur most frequently in planting and cutting sports such aa basketball, soccer, and volleyball. A sports medicine researcher wants to test if female athletes are more likely to have an ACL injury than males. He surveyed 50 collegiate programs that had both men's and woman's volleyball and asked them how many grade 3 ACL tears they had during the past season. Which statistical test would be best to determine if there is a significant diffence between groups? One sample t test Dependent samples t test Independent samples t test ANOVAarrow_forwardThe researchers hypothesised that people who receive an audiovisual presentation will have a different mean level of recall of ad information as those who receive only the visual aspects of the ad. What significance test should the researchers use for testing their hypothesis?arrow_forwardThe table below summarizes data from a survey of a sample of women. Using a 0.01 significance level, and assuming that the sample sizes of 800 men and 300 women are predetermined, test the claim that the proportions of agree/disagree responses are the same for subjects interviewed by men and the subjects interviewed by women. Does it appear that the gender of the interviewer affected the responses of women? Gender of Interviewer Man Woman Women who agree Women who disagree 556 263 244 37 Click here to view the chi-square distribution table. Identify the null and alternative hypotheses. Choose the correct answer below. O A. Ho: The response of the subject and the gender of the subject are independent. H,: The response of the subject and the gender of the subject are dependent. B. Ho: The proportions of agree/disagree responses are the same for the subjects interviewed by men and the subjects interviewed by women. H;: : The proportions are different. C. Ho: The proportions of…arrow_forward
arrow_back_ios
arrow_forward_ios
Recommended textbooks for you
- MATLAB: An Introduction with ApplicationsStatisticsISBN:9781119256830Author:Amos GilatPublisher:John Wiley & Sons Inc
 Probability and Statistics for Engineering and th...StatisticsISBN:9781305251809Author:Jay L. DevorePublisher:Cengage Learning
 Statistics for The Behavioral Sciences (MindTap C...StatisticsISBN:9781305504912Author:Frederick J Gravetter, Larry B. WallnauPublisher:Cengage Learning
  Elementary Statistics: Picturing the World (7th E...StatisticsISBN:9780134683416Author:Ron Larson, Betsy FarberPublisher:PEARSON
 The Basic Practice of StatisticsStatisticsISBN:9781319042578Author:David S. Moore, William I. Notz, Michael A. FlignerPublisher:W. H. Freeman
 Introduction to the Practice of StatisticsStatisticsISBN:9781319013387Author:David S. Moore, George P. McCabe, Bruce A. CraigPublisher:W. H. Freeman
MATLAB: An Introduction with Applications
Statistics
ISBN:9781119256830
Author:Amos Gilat
Publisher:John Wiley & Sons Inc
Probability and Statistics for Engineering and th...
Statistics
ISBN:9781305251809
Author:Jay L. Devore
Publisher:Cengage Learning
Statistics for The Behavioral Sciences (MindTap C...
Statistics
ISBN:9781305504912
Author:Frederick J Gravetter, Larry B. Wallnau
Publisher:Cengage Learning
Elementary Statistics: Picturing the World (7th E...
Statistics
ISBN:9780134683416
Author:Ron Larson, Betsy Farber
Publisher:PEARSON
The Basic Practice of Statistics
Statistics
ISBN:9781319042578
Author:David S. Moore, William I. Notz, Michael A. Fligner
Publisher:W. H. Freeman
Introduction to the Practice of Statistics
Statistics
ISBN:9781319013387
Author:David S. Moore, George P. McCabe, Bruce A. Craig
Publisher:W. H. Freeman