
MATLAB: An Introduction with Applications
6th Edition
ISBN: 9781119256830
Author: Amos Gilat
Publisher: John Wiley & Sons Inc
expand_more
expand_more
format_list_bulleted
Related questions
Topic Video
Question
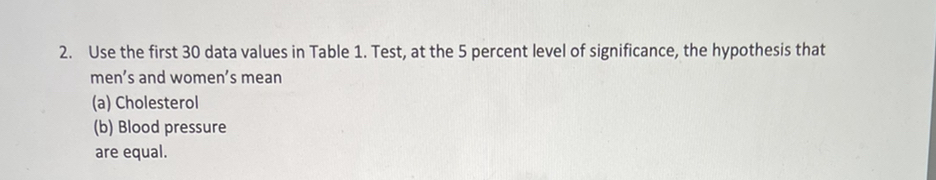

Transcribed Image Text:2. Use the first 30 data values in Table 1. Test, at the 5 percent level of significance, the hypothesis that
men's and women's mean
(a) Cholesterol
(b) Blood pressure
are equal.

Transcribed Image Text:Table 1
Student Weight Cholesterol
Gender
Student
Weight Cholesterol Pressure Gender
147
213
129
156
174
112
193
127
196
155
144
220
104
140
183
217
119
194
132
139
200
103
161
192
171
146
200
135
190
200
249
126
199
185
164
178
42
194
183
165
188
121
193
124
187
113
110
136
221
21
151
22
182
151
182
MFMFEMFEM EMMM MFFFE EMFM MMMMMM
FMFF FMFF MEMF MMFF EMMM MFMF MMFM
12 3 4 56 7 8 9o1 234567으
Expert Solution
This question has been solved!
Explore an expertly crafted, step-by-step solution for a thorough understanding of key concepts.

Step by stepSolved in 8 steps

Knowledge Booster


Learn more about
Need a deep-dive on the concept behind this application? Look no further. Learn more about this topic, statistics and related others by exploring similar questions and additional content below.Similar questions
- The mean GPA for 102 residents of the local apartment complex is 1.8 What is the best point estimate for the mean GPA for all residents of the local apartment complex?arrow_forwardA sport psychologist wanted to test the extent to which daily intake of fat in grams, and amount of exercise (in minutes) can predict health m=(measured using a Body mass index {BMI} scale in which higher scores indicate poorer health. Using the da1ta below: Fat (grams) . Exercise (minutes). Health (BMI) 8. 34. 32 11. 10. 34 5. 50. 23 9. 15. 33 8. 35. 28 5. 40. 27 6. 20. 25 4 . 60. 22 -the psychologist concluded exercise did not provide any additional information because a.) R2 = .923 b.) Adjusted R2 =.853 c.) B= -.017 d.) F change = .045;…arrow_forwardThe following histogram shows the amount of Potassium (in milligrams (mg) perserving) in 39 boxes of cereal. Use this histogram to answer the following questions. Image(a) What is the shape of this data?(b) What percent of the tested cereals have less than 80mg of potassium per serving?(c) What are the highest potassium levels in these cereals? Be as accurate as youare able.(d) What are the lowest potassium levels in these cereals? Be as accurate as you areable.arrow_forward
- Data was collected for a sample of organic snacks. The amount of sugar (in mg) in each snack is summarized in the histogram below. Frequency 10 8 6 4 2 100 101 102 103 104 105 106 10 amount of sugar (mg) What is the frequency of 102 mg of sugar? snacksarrow_forward2. Use the first 30 data values in Table 1. Test, at the 5 percent level of significance, the hypothesis that men's and women's mean (a) Cholesterol (b) Blood pressure are equal, Table 1 Student Weight Cholesterol Pressure Gender Student Weight Cholesterol Pressure Gender 147 213 127 30 129 194 184 114 2 156 174 116 M 31 111 104 112 193 110 32 156 191 118 4 127 196 110 F 33 155 221 107 F 144 220 130 34 104 212 111 6. 140 183 99 35 217 221 156 M 119 194 112 36 132 103 204 117 139 200 102 F 37 204 121 9 161 192 121 38 171 191 105 M 10 146 200 125 39 135 183 110 11 190 200 125 M 40 249 227 137 M 12 126 199 133 41 185 188 119 M 13 164 178 130 42 194 200 109 M 14 176 183 136 43 165 197 123 M 15 131 188 112 F 44 121 208 100 16 107 193 113 45 124 218 102 17 116 187 112 46 113 194 119 18 157 181 129 M 47 110 212 119 F 19 186 193 137 48 136 207 99 20 189 205 196 113 M 49 221 219 149 21 147 113 50 151 201 109 F 22 112 211 110 F 51 182 208 130 M 23 209 202 97 M 52 151 192 107 M 24 135 213 103 F…arrow_forward2. State whether the variables described have a positive correlation, a negative correlation, or no correlation. (a) Income and SAT scores (b) Length of a person's hair and how far they sit from the screen in a movie theater. (c) Hours of exercise per week and blood pressure.arrow_forward
- The percentage of scores falling below a z-score of .65arrow_forwardIt is bleieved that the percent of convicted felons who have a history of juvenile deliquency is 70%. Is there evidence to support the claim that the actual percentage is more than 70% if out of 200 convicted felons, we find that 154 have a history of juvenile deliquency? Set the level of significance at a = 0.05arrow_forwardThe claim is that the proportion of peas with yellow pods is equal to 0.25 (or 25%). The sample statistics from one experiment include 450 peas with 117 of them having yellow pods. Find the value of the test statistic.arrow_forward
- In a data set with 25 scores, if the value 16 occurs 12 times, what is its relative frequency?arrow_forwardThe first pic is the question, since I’ve been receiving some incorrect answers from the tutors, I included an example problem in the second pic.arrow_forward5. An ecologist is studying the flower Iris versicolor. He measures the width and length of 100 petals of this flower from a large collection of specimens and obtains the following data. Width: AVG = 1.3 cm, SD = 0.2 cm Length: AVG = 4.3 cm, SD = 0.5 cm r = 0.65 One of the petals is at the 30th percentile of both width and length. Relative to all the petals at the 30th percentile width, this petal's length is (circle one) smaller than average about average larger than average Justify your answer using a written explanation and/or a diagram.arrow_forward
arrow_back_ios
arrow_forward_ios
Recommended textbooks for you
- MATLAB: An Introduction with ApplicationsStatisticsISBN:9781119256830Author:Amos GilatPublisher:John Wiley & Sons Inc
 Probability and Statistics for Engineering and th...StatisticsISBN:9781305251809Author:Jay L. DevorePublisher:Cengage Learning
 Statistics for The Behavioral Sciences (MindTap C...StatisticsISBN:9781305504912Author:Frederick J Gravetter, Larry B. WallnauPublisher:Cengage Learning
  Elementary Statistics: Picturing the World (7th E...StatisticsISBN:9780134683416Author:Ron Larson, Betsy FarberPublisher:PEARSON
 The Basic Practice of StatisticsStatisticsISBN:9781319042578Author:David S. Moore, William I. Notz, Michael A. FlignerPublisher:W. H. Freeman
 Introduction to the Practice of StatisticsStatisticsISBN:9781319013387Author:David S. Moore, George P. McCabe, Bruce A. CraigPublisher:W. H. Freeman
MATLAB: An Introduction with Applications
Statistics
ISBN:9781119256830
Author:Amos Gilat
Publisher:John Wiley & Sons Inc
Probability and Statistics for Engineering and th...
Statistics
ISBN:9781305251809
Author:Jay L. Devore
Publisher:Cengage Learning
Statistics for The Behavioral Sciences (MindTap C...
Statistics
ISBN:9781305504912
Author:Frederick J Gravetter, Larry B. Wallnau
Publisher:Cengage Learning
Elementary Statistics: Picturing the World (7th E...
Statistics
ISBN:9780134683416
Author:Ron Larson, Betsy Farber
Publisher:PEARSON
The Basic Practice of Statistics
Statistics
ISBN:9781319042578
Author:David S. Moore, William I. Notz, Michael A. Fligner
Publisher:W. H. Freeman
Introduction to the Practice of Statistics
Statistics
ISBN:9781319013387
Author:David S. Moore, George P. McCabe, Bruce A. Craig
Publisher:W. H. Freeman