
MATLAB: An Introduction with Applications
6th Edition
ISBN: 9781119256830
Author: Amos Gilat
Publisher: John Wiley & Sons Inc
expand_more
expand_more
format_list_bulleted
Related questions
Question
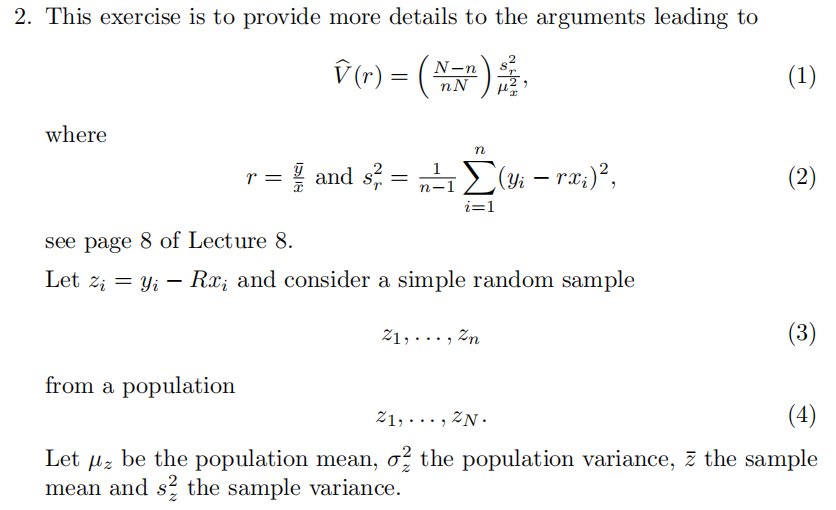

Transcribed Image Text:2. This exercise is to provide more details to the arguments leading to
V (r) = (N),
nN
where
(1)
n
r =
-1
and s² = (yi – rx;)²,
Σ
-
(2)
i=1
see page 8 of Lecture 8.
-
Let zi = yi — Rx; and consider a simple random sample
from a population
21,..., Zn
Z1, ZN
(3)
(4)
Let μz be the population mean, σ the population variance, z the sample
με
mean and s² the sample variance.

Transcribed Image Text:(a) Show that μz = 0 and express s½ in terms of the quantities in (3).
Express in terms by x, y and R.
(b) Using the formulas in Lecture 3, find an expression for Ŵ(z) in terms
of s, n and N, that is unbiased for V(z).
(c) Expand
-
-
με
r − R = 1 (r − R) + (1 − ) (r − R).
-
-
(5)
με
Show that
(r - R) =
(6)
με
με
It can be argued that the second term in (5) is small compared to
the first term. This is because ñ is a good estimator of μx and so is
close to μx when n is large. Since R is a constant, it follows that
-
V (r) = V (r − R) ≈ V(2),
(7)
where the approximation is due to ignoring the second term in (5).
Expert Solution
This question has been solved!
Explore an expertly crafted, step-by-step solution for a thorough understanding of key concepts.

Step by stepSolved in 2 steps

Knowledge Booster

Similar questions
- Give one method to increase statistical power and Which test statistic should you use if you are comparing two variances?arrow_forwardQuestion 1 iid Consider two samples 1, 2, fa with E(X) = µ and finite V(X) iid 91, 92,, yn fy with E(Y) = y and finite V (Y) = 2. Assuming that the two samples are independent, show that -y is consistent estimator for Hr - Hy. ... = o2, andarrow_forwardLet s be the sample variance of a random sample of size n1 fron a Normal(41,o²) population and s, be the sample variance of a random sample of size 12 from a Nornal(µ2,0²) population and the two samples are independent. Note that the two samples have the same population variance o² but µi # j12 and n1 # 12. Define the pooled variance estimator as (n1 – 1)sỉ + (n12 – 1)s3 T1 + n2 - 2 -- Is s? unbiased for o2 ? Explain with precisc computation. Find the distribution of ºP. Give the reasoning of your answer. Find the variance of s.arrow_forward
- If P(A) = 0.2, P (B) = 0.4 and P(A|B)) = 0.1 Compute P (AUB) Enter your answer with two decimal places.arrow_forwardOnly part Earrow_forwardWrite up your results as you would see them in a research paper. Be sure that you include the means and standard deviations for each group in your write-up, as well as a sentence or two explaining the resultsarrow_forward
arrow_back_ios
arrow_forward_ios
Recommended textbooks for you
- MATLAB: An Introduction with ApplicationsStatisticsISBN:9781119256830Author:Amos GilatPublisher:John Wiley & Sons Inc
 Probability and Statistics for Engineering and th...StatisticsISBN:9781305251809Author:Jay L. DevorePublisher:Cengage Learning
 Statistics for The Behavioral Sciences (MindTap C...StatisticsISBN:9781305504912Author:Frederick J Gravetter, Larry B. WallnauPublisher:Cengage Learning
  Elementary Statistics: Picturing the World (7th E...StatisticsISBN:9780134683416Author:Ron Larson, Betsy FarberPublisher:PEARSON
 The Basic Practice of StatisticsStatisticsISBN:9781319042578Author:David S. Moore, William I. Notz, Michael A. FlignerPublisher:W. H. Freeman
 Introduction to the Practice of StatisticsStatisticsISBN:9781319013387Author:David S. Moore, George P. McCabe, Bruce A. CraigPublisher:W. H. Freeman
MATLAB: An Introduction with Applications
Statistics
ISBN:9781119256830
Author:Amos Gilat
Publisher:John Wiley & Sons Inc
Probability and Statistics for Engineering and th...
Statistics
ISBN:9781305251809
Author:Jay L. Devore
Publisher:Cengage Learning
Statistics for The Behavioral Sciences (MindTap C...
Statistics
ISBN:9781305504912
Author:Frederick J Gravetter, Larry B. Wallnau
Publisher:Cengage Learning
Elementary Statistics: Picturing the World (7th E...
Statistics
ISBN:9780134683416
Author:Ron Larson, Betsy Farber
Publisher:PEARSON
The Basic Practice of Statistics
Statistics
ISBN:9781319042578
Author:David S. Moore, William I. Notz, Michael A. Fligner
Publisher:W. H. Freeman
Introduction to the Practice of Statistics
Statistics
ISBN:9781319013387
Author:David S. Moore, George P. McCabe, Bruce A. Craig
Publisher:W. H. Freeman