Calculus: Early Transcendentals
8th Edition
ISBN: 9781285741550
Author: James Stewart
Publisher: Cengage Learning
expand_more
expand_more
format_list_bulleted
Question

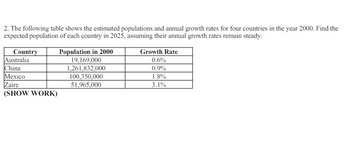
Transcribed Image Text:2. The following table shows the estimated populations and annual growth rates for four countries in the year 2000. Find the
expected population of each country in 2025, assuming their annual growth rates remain steady.
Country
Australia
Population in 2000
19,169,000
Growth Rate
0.6%
China
1,261,832,000
0.9%
Mexico
100,350,000
1.8%
Zaire
51,965,000
3.1%
(SHOW WORK)

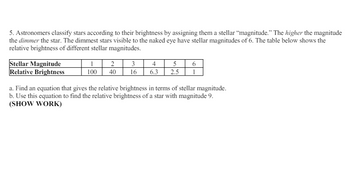
Transcribed Image Text:5. Astronomers classify stars according to their brightness by assigning them a stellar "magnitude." The higher the magnitude
the dimmer the star. The dimmest stars visible to the naked eye have stellar magnitudes of 6. The table below shows the
relative brightness of different stellar magnitudes.
Stellar Magnitude
Relative Brightness
2
3
4
5
6
100
40
16 6.3
2.5
1
a. Find an equation that gives the relative brightness in terms of stellar magnitude.
b. Use this equation to find the relative brightness of a star with magnitude 9.
(SHOW WORK)
Expert Solution
This question has been solved!
Explore an expertly crafted, step-by-step solution for a thorough understanding of key concepts.
This is a popular solution
Trending nowThis is a popular solution!
Step by stepSolved in 2 steps

Knowledge Booster
Similar questions
- mni.2arrow_forward2arrow_forwardQuarterly Glass Container Demand Year 1990 1991 1992 First Qtr. 17,446. 17,748. 17,595. Second Qtr. 17,785. 19,360. 18,338. Third Qtr. 18,971. Fourth Qtr. 19140. 17,802. 19,413. 18,315. 18,083. Question: Quarterly sales (in thousands of units) of a product over the last two years have been 26, 29, 30, 27, 28, 32, 33, and 30. Plot the data and forecast for the next period using Winter's Seasonal Model. Now, assume sales for the ninth quarter turned out to be 32. Update your parameter estimates and forecast sales for period 10.arrow_forward
Recommended textbooks for you
 Calculus: Early TranscendentalsCalculusISBN:9781285741550Author:James StewartPublisher:Cengage Learning
 Thomas' Calculus (14th Edition)CalculusISBN:9780134438986Author:Joel R. Hass, Christopher E. Heil, Maurice D. WeirPublisher:PEARSON
 Calculus: Early Transcendentals (3rd Edition)CalculusISBN:9780134763644Author:William L. Briggs, Lyle Cochran, Bernard Gillett, Eric SchulzPublisher:PEARSON
 Calculus: Early TranscendentalsCalculusISBN:9781319050740Author:Jon Rogawski, Colin Adams, Robert FranzosaPublisher:W. H. Freeman
 Calculus: Early Transcendental FunctionsCalculusISBN:9781337552516Author:Ron Larson, Bruce H. EdwardsPublisher:Cengage Learning

Calculus: Early Transcendentals
Calculus
ISBN:9781285741550
Author:James Stewart
Publisher:Cengage Learning

Thomas' Calculus (14th Edition)
Calculus
ISBN:9780134438986
Author:Joel R. Hass, Christopher E. Heil, Maurice D. Weir
Publisher:PEARSON

Calculus: Early Transcendentals (3rd Edition)
Calculus
ISBN:9780134763644
Author:William L. Briggs, Lyle Cochran, Bernard Gillett, Eric Schulz
Publisher:PEARSON

Calculus: Early Transcendentals
Calculus
ISBN:9781319050740
Author:Jon Rogawski, Colin Adams, Robert Franzosa
Publisher:W. H. Freeman


Calculus: Early Transcendental Functions
Calculus
ISBN:9781337552516
Author:Ron Larson, Bruce H. Edwards
Publisher:Cengage Learning